
Benchmarking YouTube Thumbnails: 5 Key Metrics to Track
Want more clicks and engagement on your YouTube videos? It starts with your thumbnails. Tracking the right metrics can help you design thumbnails that attract more viewers and keep them watching. Here's what you need to know:
- Click-Through Rate (CTR): Measures how many people click your video after seeing the thumbnail. A CTR of 6-10% is strong, but anything over 10% can push your video toward virality.
- Impressions: Tracks how often your thumbnail is shown. High impressions with low CTR? Your design might not be grabbing attention.
- CTR by Traffic Source: Analyze how thumbnails perform on Search, Suggested, or Browse. Each source has unique benchmarks.
- Average View Duration (AVD): High clicks but low AVD? Your thumbnail might not match the video content.
- Audience Retention: Steady retention suggests your thumbnail aligns well with your video. Poor retention means viewers are leaving early.
Key Insight: Even small tweaks - like simplifying text or testing bold colors - can boost CTR by 20-40%. Combine strong CTR with solid AVD and retention to maximize video visibility. Use YouTube Analytics to test, track, and refine for better results.
1. Click-Through Rate (CTR)
Relevance to Thumbnail Performance
Click-Through Rate (CTR) represents the percentage of viewers who click on your video after seeing its thumbnail. It's calculated as (clicks ÷ impressions) × 100, making it a direct measure of how appealing your thumbnail is. YouTube heavily relies on CTR as a key indicator when deciding which videos to promote in Suggested and Browse feeds. Even a small change - like a 0.5% difference - can have a huge impact when scaled across millions of impressions. Since over 70% of YouTube watch time happens on mobile devices, using AI thumbnail generation to create thumbnails that stand out on smaller screens is more important than ever.
Ability to Benchmark Against Competitors
A raw CTR percentage (like 4.5%) doesn’t mean much without context. Benchmarking against competitors helps you understand how your performance stacks up within your niche. For example, the YouTube creator JackSucksAtLife saw a 978% increase in views after swapping thumbnails, highlighting how impactful a well-designed thumbnail can be. Many top creators even test 20–30 thumbnail variations for a single video.
| CTR Range | Performance Category | Potential Outcome |
|---|---|---|
| 4–5% | Average | Consistent but modest growth |
| 6–10% | Great | Strong chance of being recommended |
| 10%+ | Viral | Likely to receive major algorithmic boosts |
Impact on Video Engagement and Visibility
CTR drives both clicks and visibility. YouTube experiments with video exposure, starting with small-scale testing and expanding based on early performance. A high CTR within the first 24–72 hours can create momentum for your video.
"Thumbnails and titles are the two most powerful levers for CTR, but thumbnails almost always carry more weight in attracting a casual scroller to pause and click."
- Creator Insider, YouTube's Official Creator Channel
However, CTR isn’t everything. If viewers click but leave quickly, it signals a mismatch between the promise of the thumbnail and the actual content - something often referred to as the "clickbait trap". To avoid this, a high CTR must be paired with strong Average View Duration to maintain credibility with YouTube's algorithm.
Usefulness in Identifying Optimization Opportunities
Breaking down CTR by traffic source can reveal where improvements are needed. For instance, search-driven traffic often achieves a CTR of 6–12%, while Browse features typically range from 3–6%. If your Browse CTR is falling short, it might mean your thumbnail isn’t grabbing enough attention on YouTube's interface.
Take growth expert Nick Nimmin, for example. He replaced a cluttered thumbnail with a simpler, high-contrast design for one of his evergreen videos. This small change boosted CTR by 2%, resulting in consistent daily view increases. To optimize thumbnails effectively, test them at 120×67 pixels to ensure they’re legible on small screens. Stick to bold, high-contrast colors and limit text to 3–5 words to make them easier to process at a glance.
sbb-itb-b59debf
2. Impressions
Relevance to Thumbnail Performance
An impression happens whenever your thumbnail appears on someone's screen. Impressions play a key role in calculating your click-through rate (CTR). A high number of impressions gives your video more exposure, and when paired with an eye-catching thumbnail, it creates a positive cycle: more clicks, better watch data, and increased promotion by YouTube’s algorithm. If you’re seeing a lot of impressions but a low CTR, it means YouTube is showing your video, but your thumbnail isn’t enticing enough for viewers to click.
Ability to Benchmark Against Competitors
Impressions, when combined with CTR insights, help you measure your video’s performance against others. However, raw impression numbers don’t tell the whole story - you need to compare CTRs across traffic sources for context. For instance, CTRs typically range between 6–12% for YouTube Search, 4–8% for Suggested Videos, and 3–6% for Browse Features like the homepage. If your Browse CTR is only 2% while competitors in your niche average 5%, it’s a clear signal to make improvements. Use the Reach tab in YouTube Studio to see where your impressions are coming from and how effectively they convert.
Impact on Video Engagement and Visibility
Early impressions are crucial - they can make or break your video’s momentum. YouTube evaluates this initial data to decide whether to boost your video’s reach. Even small changes in CTR, as little as 0.5%, can significantly influence performance. For example, a thumbnail with a 10% CTR will generate five times more clicks than one with a 2% CTR from the same number of impressions. With over 70% of YouTube watch time happening on mobile devices, your thumbnail must grab attention in a crowded, fast-scrolling environment.
Usefulness in Identifying Optimization Opportunities
To make meaningful improvements, ensure each thumbnail variation has at least 1,000 impressions before drawing conclusions. For evergreen videos with steady impressions but a declining CTR, a redesigned thumbnail can breathe new life into traffic. Focus on videos with high impressions but low click rates, and experiment with advanced thumbnail optimization during the critical launch period. This approach allows for precise comparisons when analyzing overall performance metrics.
3. CTR by Traffic Source
Relevance to Thumbnail Performance
Tracking click-through rate (CTR) by traffic source gives you a clearer picture of where your thumbnails are connecting with viewers. YouTube Studio's Reach tab breaks down CTR by sources like Browse, Search, and Suggested Videos, showing how performance shifts depending on how viewers find your content. For example, a thumbnail that grabs attention in Search might not perform as well in Browse, where users often scroll quickly. This analysis helps you fine-tune your thumbnails to better suit each traffic source.
Ability to Benchmark Against Competitors
Looking at CTR by source also helps you set practical benchmarks. Start by studying the thumbnails that dominate your niche. Pay attention to elements like color schemes, text placement, and facial expressions, which can vary significantly between Search results and the homepage. Searching for top-performing videos using relevant keywords, especially those with the most views in the last 30 days, can reveal patterns in thumbnail design that resonate with your target audience.
Impact on Video Engagement and Visibility
CTR alone doesn’t tell the whole story - pairing it with Average View Duration (AVD) gives deeper insights. For instance, a high CTR from Browse features combined with low watch time might mean your thumbnail is attracting clicks but not delivering on expectations. On the other hand, a slightly lower CTR from Search traffic with strong viewer retention suggests your content is engaging the right audience. This balance between clicks and engagement is key to building long-term visibility.
Usefulness in Identifying Optimization Opportunities
Traffic source data highlights specific areas for improvement. If Suggested Videos show a low CTR, consider experimenting with more striking visuals or stronger facial expressions. If your Search traffic performs well but homepage results lag, simplifying your thumbnail design - like reducing text - might make it more eye-catching in fast-paced scrolling environments. A/B testing vs gut feeling across different traffic sources can reveal what works best, turning trial-and-error into a more systematic approach. These insights allow you to make smarter design adjustments tailored to each audience segment.
4. Average View Duration
Relevance to Thumbnail Performance
Average View Duration (AVD) plays a key role in evaluating how well your thumbnail resonates with viewers. While Click-Through Rate (CTR) measures whether your thumbnail grabs attention, AVD reveals if it brought in the right audience - those genuinely interested in watching your content. Essentially, your thumbnail and title set expectations, and if those expectations aren't met, AVD tends to drop.
"If your CTR is high but AVD is low, your thumbnail might be clickbaity or misleading." – YouGenie
For YouTube's algorithm, the combination of high CTR and strong AVD is a winning formula. It doesn’t just care about clicks; it focuses on Watch Time Per Impression, calculated as CTR × AVD. When both metrics perform well, YouTube is more likely to promote your video in Suggested and Browse feeds. A good rule of thumb is to aim for an AVD of at least 50% of your video’s total length. This not only confirms that your thumbnail delivers on its promise but also impacts your video’s overall engagement potential.
Impact on Video Engagement and Visibility
If more than 40% of viewers leave within the first 30 seconds of your video, it’s often a sign that your thumbnail and video content aren’t aligned. Avoiding common thumbnail mistakes is crucial, as misleading designs can erode viewer trust over time.
YouTube’s "Test & Compare" feature prioritizes watch time over CTR when selecting the best thumbnail variant. As one creator humorously observed:
"I closed my mouth on all my thumbnails and the watch time went up on every video lol" – MrBeast
Even small tweaks to your thumbnail design can influence how long viewers stick around.
Usefulness in Identifying Optimization Opportunities
AVD does more than confirm engagement - it helps identify design or messaging issues that need adjustment. For example, if certain thumbnail styles, like exaggerated facial expressions or mystery-driven visuals, repeatedly lead to sharp AVD drops, it might mean those elements are creating a mismatch between expectation and reality. Fixing this isn’t always about changing the thumbnail itself; sometimes, it’s about ensuring the video’s opening moments align better with the thumbnail’s promise. For mobile viewers especially, the opening hook needs to seamlessly connect with what the thumbnail suggests.
When running A/B tests on thumbnails, track both CTR and AVD together. A new thumbnail that slightly lowers AVD but significantly boosts CTR might still be a net positive if it increases total watch time. The key is to evaluate the overall impact on minutes watched - if the gains outweigh the losses, the new thumbnail is a keeper.
5. Audience Retention
Relevance to Thumbnail Performance
Audience retention is a key measure of whether your thumbnail is pulling in the right viewers - not just generating clicks. If retention remains steady throughout your video, it’s a strong sign that your thumbnail aligns well with the content. On the flip side, if viewers click but quickly abandon the video, it suggests a mismatch between what the thumbnail promises and what the video delivers.
Studies show that retention improves when thumbnails accurately represent the content. This alignment is critical because it not only keeps viewers engaged but also influences other metrics like overall engagement and viewer retention.
Impact on Video Engagement and Visibility
YouTube’s algorithm doesn’t just look at clicks - it also tracks what happens after. Both click-through rate (CTR) and retention are key factors that determine whether your video gets pushed to the homepage or suggested sections. If your thumbnail attracts viewers who stick around, YouTube sees this as a signal of quality and expands your video’s reach. However, a high CTR combined with poor retention indicates the thumbnail may have over-promised, leading the algorithm to limit recommendations to maintain a good user experience. In essence, solid audience retention works hand-in-hand with high CTR and average view duration (AVD) to maximize your video's visibility.
Usefulness in Identifying Optimization Opportunities
Audience retention offers valuable insights alongside metrics like CTR, impressions, and AVD. By examining the audience retention graph in YouTube Studio, you can spot patterns - such as viewers dropping off immediately after clicking - that suggest your thumbnail might be attracting the wrong audience or creating unrealistic expectations. This feedback gives you a clear chance to redesign your thumbnail to better reflect the video’s actual content.
When testing different thumbnails, aim for one that balances a strong CTR with steady retention. Sometimes, a thumbnail that slightly lowers CTR but significantly improves retention can yield better overall results. The goal is to create a thumbnail that acts as an honest "storefront window", attracting viewers who are genuinely interested in your content rather than just curious clickers who leave quickly.
For extra help, tools like ThumbnailCreator can assist in testing designs to ensure your thumbnails accurately represent your content and resonate with your target audience.
How to Get YouTube to Push Your Video (Simple Fix That Works)
Metric Comparison Tables
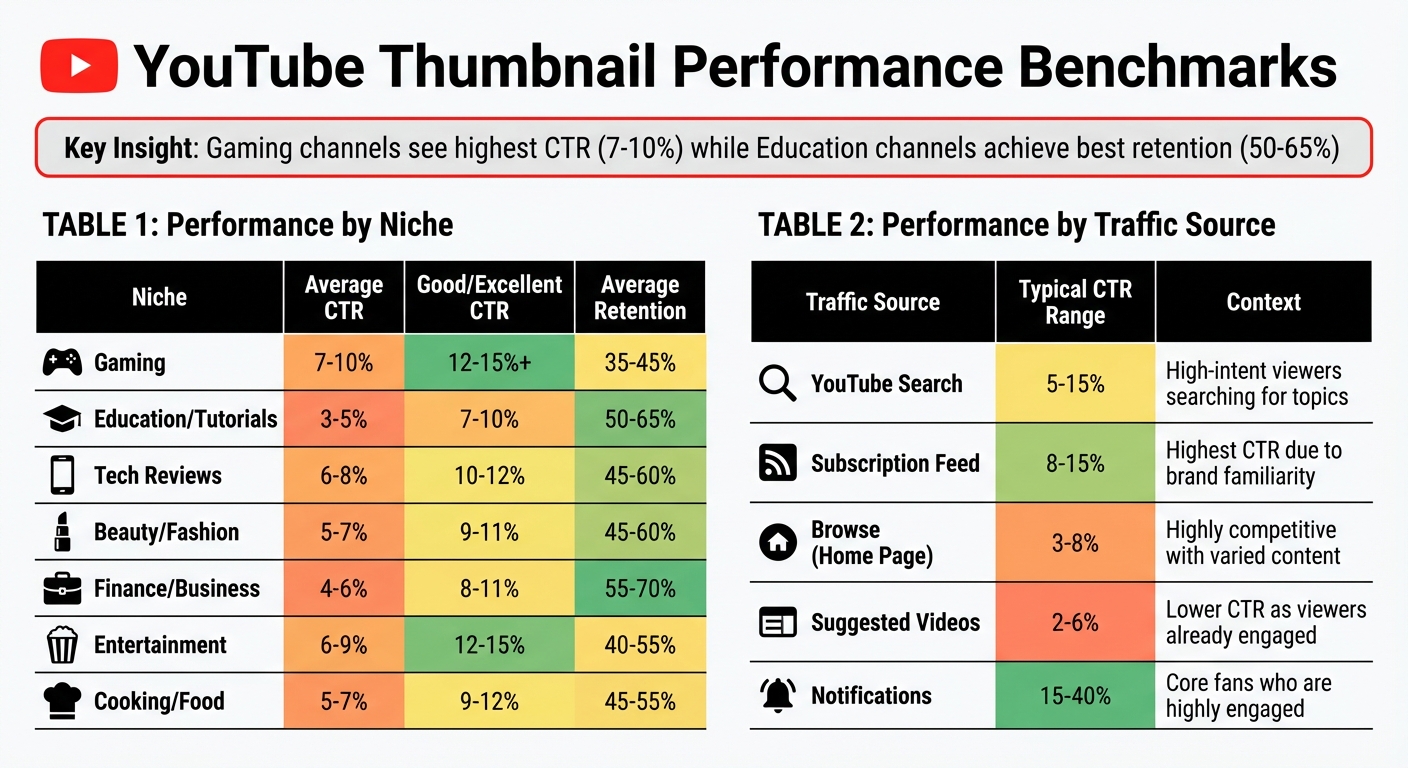
YouTube Thumbnail Performance Benchmarks by Niche and Traffic Source
These benchmark tables can help you measure your thumbnail performance against industry norms and identify areas for improvement. By tracking monthly thumbnail trends, you can see how these benchmarks shift, highlighting expected performance by niche and traffic source, offering a clear look at where your thumbnails stand and how they can be optimized.
CTR differs significantly by niche. For instance, gaming channels often see higher click-through rates (CTR), usually around 7–10%. This is because gaming audiences tend to make quick, emotion-driven decisions when choosing content. On the other hand, educational channels typically experience lower CTRs, around 3–5%, as their viewers are more deliberate in their choices. However, these channels often make up for it with better audience retention, ranging from 50–65%. The table below provides a quick overview of performance averages by niche.
| Niche | Average CTR | Good/Excellent CTR | Average Retention |
|---|---|---|---|
| Gaming | 7–10% | 12–15%+ | 35–45% |
| Education / Tutorials | 3–5% | 7–10% | 50–65% |
| Tech Reviews | 6–8% | 10–12% | 45–60% |
| Beauty / Fashion | 5–7% | 9–11% | 45–60% |
| Finance / Business | 4–6% | 8–11% | 55–70% |
| Entertainment | 6–9% | 12–15% | 40–55% |
| Cooking / Food | 5–7% | 9–12% | 45–55% |
Traffic source matters just as much as niche. Analyzing where your viewers come from can refine your thumbnail strategy further. For example, subscription feeds often yield the highest CTRs, ranging from 8–15%, because these viewers are already familiar with your content and brand. Conversely, suggested videos have a much lower CTR (2–6%) since viewers are already engaged with other content and less likely to switch focus.
| Traffic Source | Typical CTR Range | Context |
|---|---|---|
| YouTube Search | 5–15% | High-intent viewers searching for topics |
| Subscription Feed | 8–15% | Highest CTR due to brand familiarity |
| Browse (Home Page) | 3–8% | Highly competitive with varied content |
| Suggested Videos | 2–6% | Lower CTR as viewers are already engaged |
| Notifications | 15–40% | Core fans who are highly engaged |
Retention is influenced by video length. For example, a 60% retention rate is considered strong for a 3-minute video and exceptional for a 20-minute one. If your longer videos are achieving 45–50% retention, you're within the expected range and performing well.
Conclusion
Targeted testing, guided by key performance metrics, is a powerful way to drive success on YouTube. By focusing on Click-Through Rate (CTR), Impressions, CTR by Traffic Source, Average View Duration (AVD), and Audience Retention, creators can move beyond guesswork and make data-driven decisions to enhance views and engagement. For instance, comparing CTR with AVD can reveal potential mismatches - like a high CTR paired with a low AVD, which often signals that the thumbnail may have set unrealistic viewer expectations. Instead of relying on personal preferences, this approach lets real viewer behavior validate design choices.
Competitor analysis also plays a key role in shaping thumbnail strategies. By observing successful videos in your niche, you can spot trends - such as effective color palettes, emotional expressions, or text placement - without starting from scratch. For example, in November 2025, a tech review channel with 287,000 subscribers conducted a test comparing two thumbnails: one featuring only the product and another including the creator’s face with a surprised expression. The face-inclusive thumbnail achieved a 9.19% CTR, outperforming the product-only version’s 7.32% CTR by 25.5%, with no notable drop in AVD over seven days.
"Study successful channels in your niche for inspiration, but test everything on your own channel. Cross-channel assumptions are hypothesis generators, not conclusions."
- Marcus Chen, YouTube Optimization Consultant
Tools like ThumbnailCreator simplify the process of applying these insights. With its user-friendly features, creators can design professional thumbnails in seconds - no design skills required. The platform makes it easy to create distinct variants for A/B testing, such as comparing thumbnails with or without faces, experimenting with different colors, or adjusting text sizes. Using YouTube’s "Test & Compare" feature, you can measure which version generates more watch time. Considering that over 70% of YouTube watch time happens on mobile devices, ThumbnailCreator ensures thumbnails remain clear and clickable even on smaller screens, safeguarding your CTR across all devices.
Once a winning thumbnail is identified, it becomes the new benchmark for further testing. This iterative process allows creators to turn small improvements into measurable growth over time.
FAQs
What’s a good CTR for my channel’s niche?
A good click-through rate (CTR) on YouTube generally ranges from 6% to 10% across most niches. If your CTR exceeds 10%, your content might be edging into viral territory. These benchmarks are a useful way to assess how well your thumbnails are performing and pinpoint where adjustments might be needed.
How many impressions do I need before judging a thumbnail test?
To properly assess the results of a thumbnail test, aim for 200–300 views per video. This sample size provides enough data to draw reliable conclusions about how well the thumbnails are performing.
Which matters more: higher CTR or higher watch time?
While Click-Through Rate (CTR) measures how effective a thumbnail is at grabbing attention, watch time plays a far bigger role in long-term channel success. Watch time reflects how engaged and retained your viewers are, and that’s what algorithms love to see.
Sure, a solid CTR - typically between 2% and 10% - is important for attracting those initial clicks. But if viewers don’t stick around to watch your content, that initial click won’t mean much. Prioritizing watch time and keeping viewers engaged has a much stronger influence on your channel’s performance over time.