
Analyzing Viewer Behavior: A/B Testing Thumbnails
Want more clicks on your YouTube videos? Test your thumbnails to see which designs perform best. Thumbnails influence 90% of viewer click decisions, making them a critical part of your content strategy. A/B testing allows you to compare different thumbnail designs to find the one that gets the most engagement. Tools like YouTube's "Test & Compare" make this process simple and data-driven.
Key takeaways:
- Test one thumbnail variable at a time (e.g., color, text, or images).
- Use YouTube's "Test & Compare" tool to gather data over 7–14 days.
- Focus on Watch Time Share over CTR to ensure meaningful engagement.
- A small improvement in CTR (e.g., 1%) can significantly boost views.
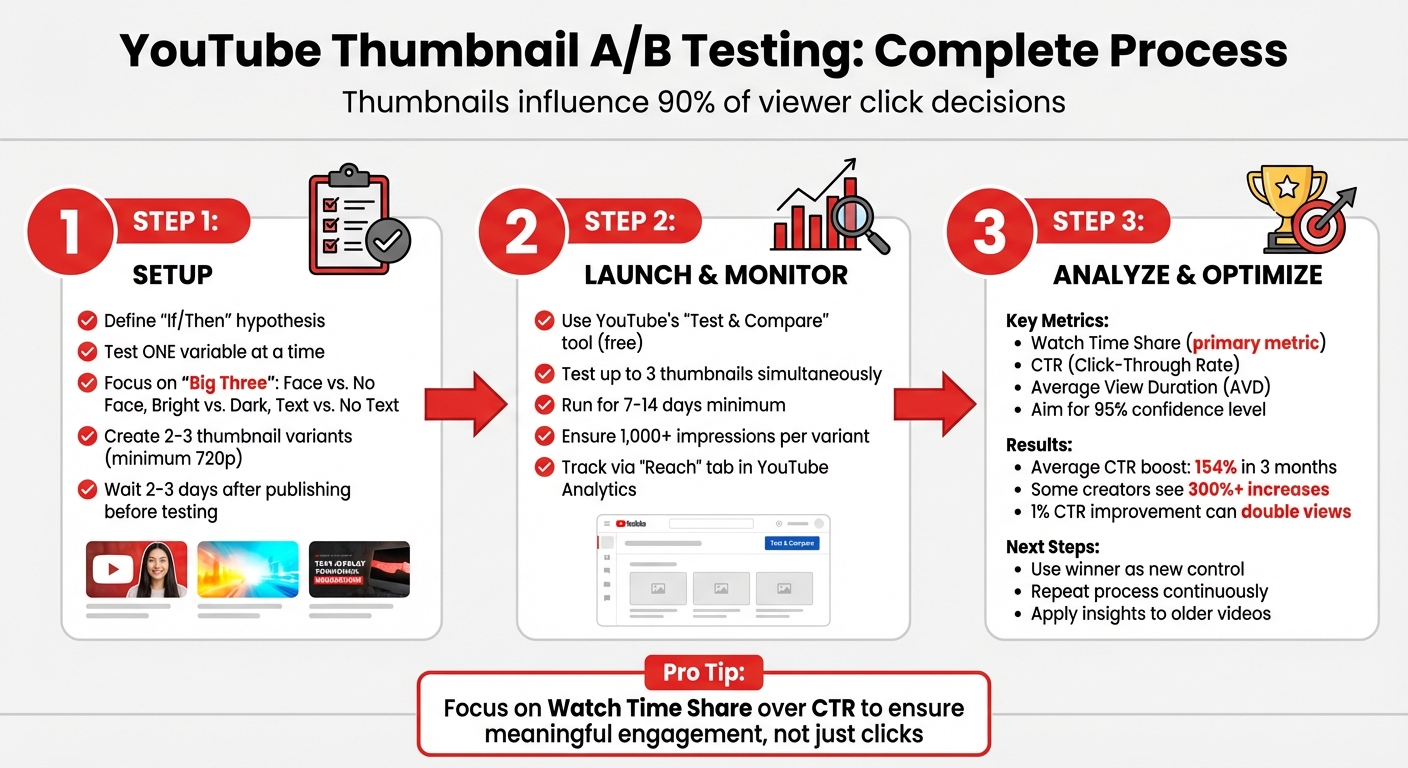
YouTube Thumbnail A/B Testing Process: 3-Step Guide to Increase CTR
Setting Up an A/B Test
Define Your Hypothesis and Test Variables
Start with a clear "If/Then" hypothesis. For example: "If I use a close-up emotional face instead of a wide shot, then the CTR will increase because it creates a stronger personal connection." This forces you to think about why a change might work, not just what you're changing.
Focus on testing one major element at a time. The "Big Three" variables to consider are: Face vs. No Face, Bright vs. Dark color schemes, and Text vs. No Text. These tend to drive the most noticeable shifts in performance.
Avoid common thumbnail mistakes like getting bogged down in small details or subtle facial expressions. Instead, experiment with broader changes, such as entirely new imagery or a different value proposition, especially if your video isn’t performing well.
Keep a detailed log of each variant, including screenshots, dates, and outcomes. Over time, this record can reveal patterns in your audience's preferences.
Once your hypothesis is set, you can focus on creating variations that highlight what truly impacts viewer behavior.
Create Thumbnail Variations
Design 2–3 thumbnail variants, each isolating a single variable. For instance, if you’re testing color schemes, keep everything else - like facial expressions, text, and layout - consistent. This ensures that any performance differences can be traced back to the variable you’re testing.
Consistency with your brand is key. Even as you tweak designs, make sure your thumbnails still align with your channel’s overall look. For example, if testing "Face vs. No Face", stick to your usual fonts and color palette so viewers still recognize your content.
Remember, YouTube’s "Test & Compare" tool requires thumbnails to be at least 720p. Otherwise, all variants will be downscaled to 480p, which could affect results.
Launch and Monitor Your Test
Once your thumbnail variations are ready, it’s time to test them.
Use YouTube’s "Test & Compare" feature in YouTube Studio. Select your video, click the three-dot menu in the thumbnail section, and upload your variants. This free tool allows you to test up to three thumbnails simultaneously, showing each version to different viewers at the same time.
Run the test for 7–14 days, or longer if impressions are below 10,000 per week. Each variant should receive at least 1,000 impressions to ensure reliable data. Track results through the "Reach" tab in YouTube Analytics or the "Manage test" section on the video details page.
Wait 2–3 days after publishing a video before starting a test. This avoids skewed data from early, loyal subscribers. Also, avoid changing the video’s title or thumbnail manually during the test, as this will automatically stop the experiment.
sbb-itb-b59debf
YouTube A/B Thumbnail Testing EXPLAINED!
Analyzing Results and Making Changes
Interpreting your A/B test data is a key step in fine-tuning your thumbnail strategy to boost viewer engagement. Once your test wraps up, focus on the metrics that show how viewers interacted with each variation.
Key Metrics to Track
YouTube's "Test & Compare" tool emphasizes Watch Time Share over CTR (Click-Through Rate). Why? Because this metric reflects the percentage of total watch time each thumbnail variation generates, ensuring your design attracts meaningful engagement.
CTR measures how many viewers clicked after seeing your thumbnail, while Average View Duration (AVD) tells you if the thumbnail accurately represents your content. A high CTR paired with a low AVD could signal clickbait issues. Additionally, monitor impressions - the number of times each thumbnail was displayed. Aim for at least 1,000 impressions per variation for reliable data.
Other useful indicators include subscriber conversion rates and engagement metrics like comments and shares. These secondary metrics can give you a broader picture of how well your thumbnail performs.
With this data in hand, you can confidently pick the design that stands out.
Choose the Winning Thumbnail
YouTube Studio makes it easy to identify a winner by highlighting the best-performing thumbnail when one variation statistically outshines the rest. If you see labels like "Performed Same" or "Inconclusive", it usually means the variations were too similar to produce a clear result.
Focus on watch time over CTR. A thumbnail with a slightly lower CTR but higher AVD often delivers better results because it aligns more closely with what viewers expect from the content. For instance, Arvid Kahl from The Bootstrapped Founder shared how swapping out a stagnant thumbnail on a video with 15,000 views led to a surge - hitting 120,000 views in just 21 days.
Once you’ve identified the top performer, the next step is to build on that success.
Repeat the Process for Ongoing Improvement
Use your winning thumbnail as the new benchmark. From there, test fresh variations against this "control" design, applying the same hypothesis-driven approach you used initially. Creators who consistently A/B test their thumbnails have reported average CTR boosts of 154% in just three months, with some seeing increases of over 300%.
If a specific design element proves effective - like a bright background - apply it across your channel for consistency. You can also revisit older, underperforming videos and update their thumbnails to reignite interest and maximize their reach.
Consistent testing ensures your thumbnails stay relevant as audience preferences shift over time.
Best Practices for Thumbnail A/B Testing
If you want to take your channel's performance to the next level, mastering thumbnail A/B testing is a must. But it’s not just about uploading different designs and hoping for the best - there’s a method to the madness.
Test One Variable at a Time
When running A/B tests, focus on isolating one major element at a time. This approach helps you clearly connect changes to results. For example, you can compare a surprised expression versus a serious one, warm colors versus cool tones, text placement at the top versus the bottom, or even close-up shots versus wide angles. Avoid making minor tweaks like adjusting font colors, as these rarely lead to meaningful insights.
Here’s why it matters: Thumbnails drive 90% of click decisions. Creators who consistently test isolated variables have seen an average 23% increase in click-through rates (CTR), with some achieving improvements as high as 50–100% through systematic testing.
Once you’ve picked a single variable to test, focus on gathering enough data to ensure your results are reliable.
Collect Enough Data Before Deciding
Don’t rush to conclusions. Testing takes time, and jumping the gun can waste your efforts. For reliable results, each thumbnail variation needs at least 1,000 impressions, with the sweet spot being 1,000–5,000 impressions and around 100 clicks over a minimum of 14 days. Channels with fewer than 10,000 weekly impressions may need to extend their testing periods.
Make sure you aim for a 95% confidence level before calling a winner. Anything less increases the risk that your results are just random noise, not a true indicator of audience preference.
Use ThumbnailCreator to Create Variations Quickly
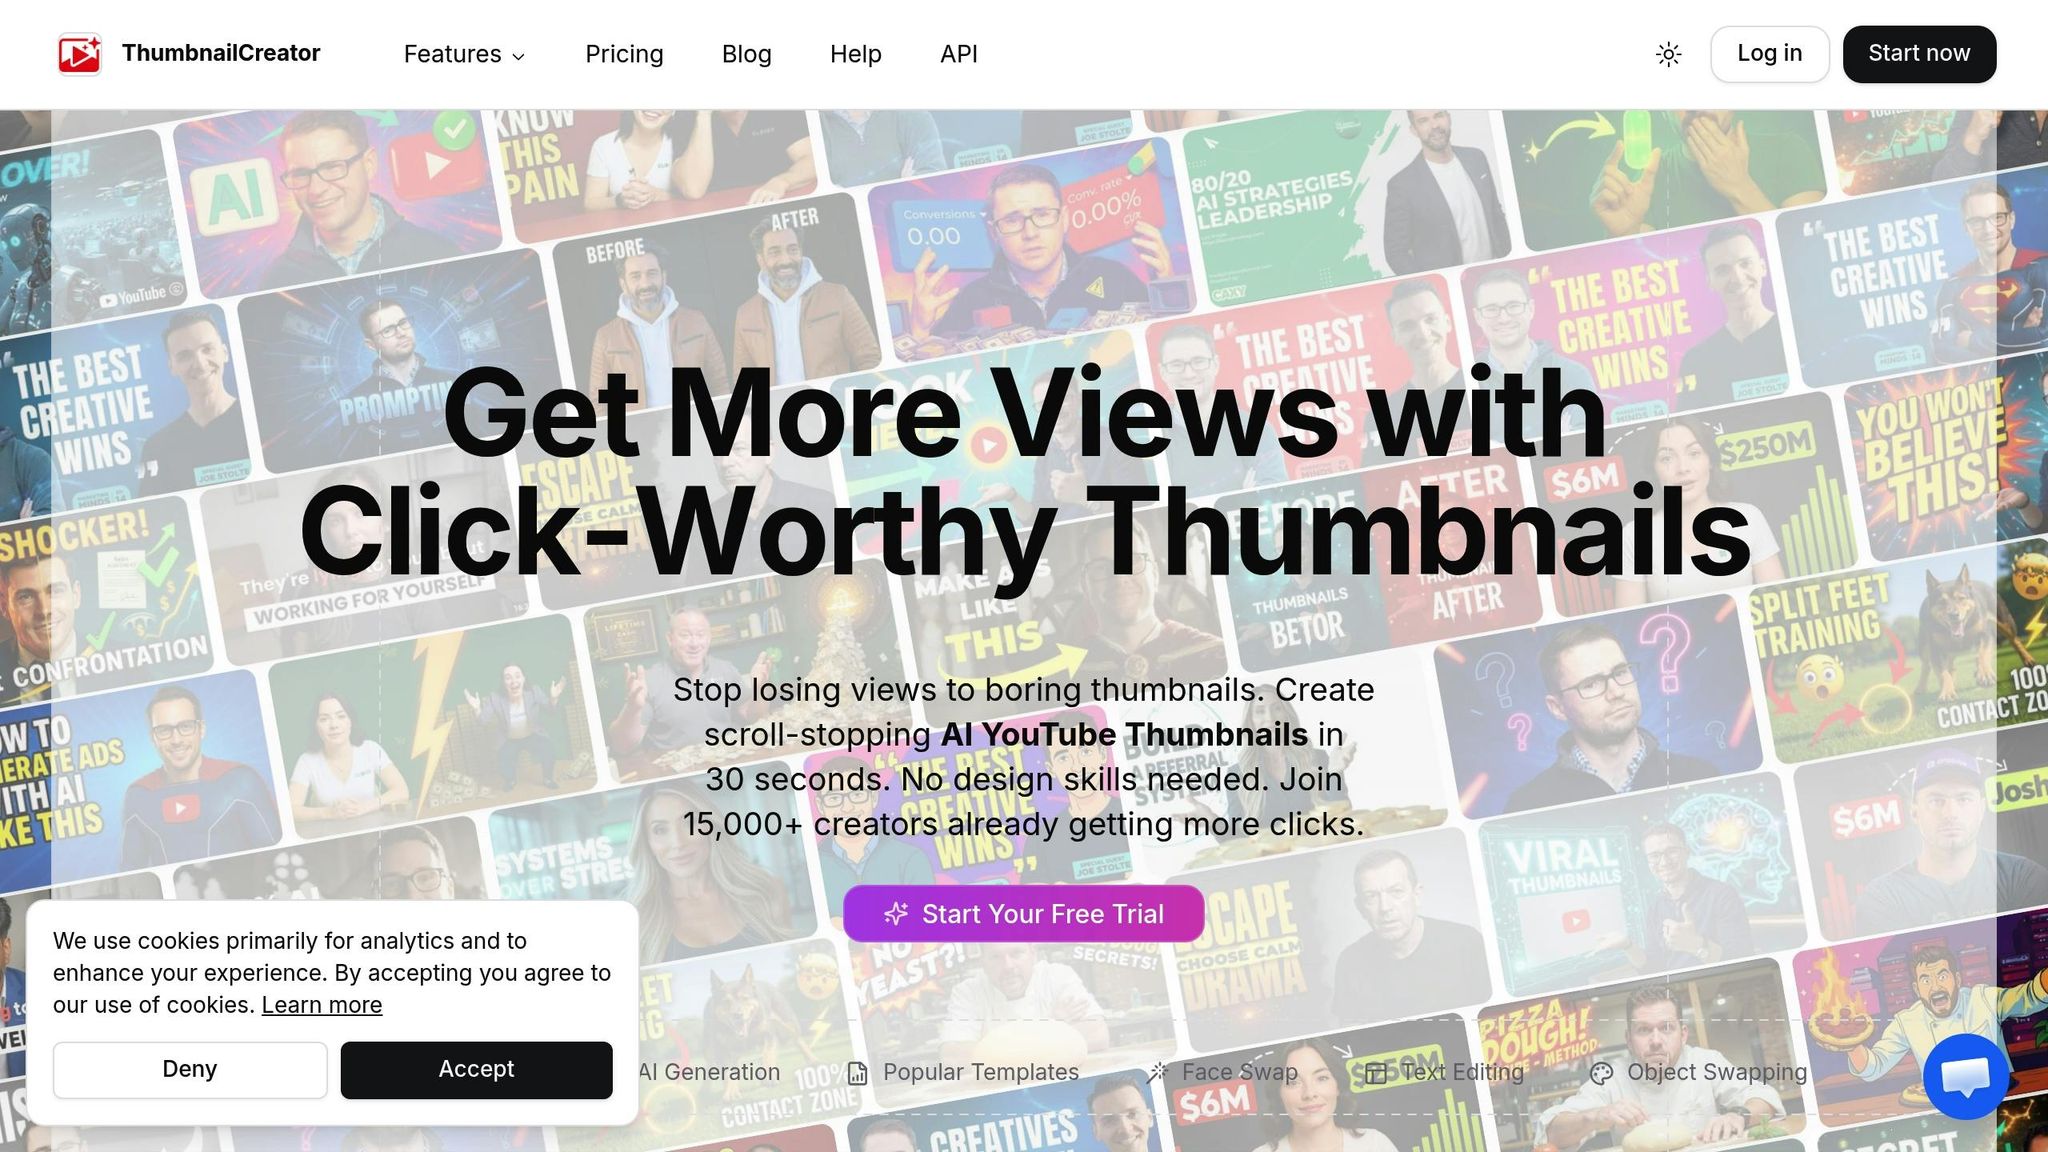
Once you’ve gathered actionable data, the next step is to speed up your design process. Manually creating thumbnail variations can slow you down, but tools like ThumbnailCreator make it easy. With features like AI-powered generation, popular templates, face swapping, and object swapping, you can create multiple designs in seconds - no advanced design skills required.
Why is speed important? Because even a 1% boost in CTR could potentially double your video’s views. The quicker you test and refine, the faster you’ll uncover what works best for your audience. Plus, you can experiment with bold changes, like testing thumbnails with a face versus no face or bright versus dark color schemes, without spending hours in complicated design software.
This tool also provides an easy way to refresh older videos that aren’t performing well. By optimizing your older content, you can maximize your channel’s overall potential - not just focus on new uploads.
Conclusion: Using A/B Testing to Grow Your Channel
After setting up and analyzing A/B tests, the next step is using those insights to fuel your channel's growth.
A/B testing sharpens the signals that YouTube's algorithm relies on. When your click-through rate (CTR) improves, YouTube sees your content as more engaging and relevant. Over time, these small but steady gains lead to more impressions, higher rankings, and better visibility.
By designing thumbnails based on actual data, you eliminate the guesswork. Essentially, you're letting your audience show you what resonates with them. Creators who consistently test their thumbnails often see noticeable jumps in their CTR.
But it’s not just about clicks. YouTube values watch time more than raw clicks, so a strong thumbnail should attract viewers who stick around and engage with your content. This strategy helps build a loyal audience and ensures your channel thrives in the long run.
Key Takeaways
- Test one variable at a time - like facial expressions, background colors, or text placement - so you can pinpoint what drives changes in performance. Make sure each variation gathers enough data, and aim for a 95% confidence level to ensure your results are reliable and not due to chance.
- Use tools like ThumbnailCreator to streamline your process. Features like AI-powered design tools, templates, and object swapping allow you to create multiple variations quickly, even without design expertise. This lets you experiment more efficiently based on viewer feedback.
- Don’t overlook older videos. A/B testing can breathe new life into them by improving their CTR. Keep a detailed log of your tests to spot patterns across your channel, and use successful thumbnails as a starting point for future designs. Over time, these small improvements can add up to meaningful, sustainable growth.
FAQs
What makes a thumbnail A/B test statistically reliable?
A thumbnail A/B test becomes reliable when it runs for at least two weeks, collects thousands of impressions, and examines important metrics such as watch time and engagement. This approach ensures the results are grounded in enough data to confidently determine which thumbnail performs better.
Why does Watch Time Share matter more than CTR?
YouTube values Watch Time Share more than Click-Through Rate (CTR). Why? Because the platform's algorithm leans heavily on audience retention and total watch time to gauge video performance. While a high CTR might get people to click, it doesn't necessarily mean they'll stick around or engage. Watch time, on the other hand, reflects sustained viewer interest and plays a bigger role in boosting rankings.
How do I pick the best thumbnail if results are inconclusive?
If the results are unclear, prioritize the thumbnail that aligns most closely with your audience's tastes and contributes positively to the video’s overall performance. Look beyond just the click-through rate (CTR); metrics like watch time and retention can provide a more complete picture when making your choice.