
CTR vs. Watch Time: Key Metrics for Thumbnail Impact
Your YouTube thumbnail plays a major role in whether someone clicks on your video. But grabbing attention isn’t enough. Success depends on two key metrics:
- Click-Through Rate (CTR): Measures how often people click after seeing your thumbnail. A strong CTR (4–6% average) gets your video noticed.
- Watch Time: Tracks how long viewers stay engaged. High watch time signals quality and helps your video get recommended.
The key takeaway? A good thumbnail isn’t just about getting clicks - it’s about delivering on its promise to keep viewers watching. Misleading thumbnails may boost clicks temporarily but hurt long-term growth by reducing retention.
Quick Tips:
- Use clear, expressive faces to boost CTR by 25–50%.
- Keep text short (under four words) for a 30% CTR increase.
- Match your thumbnail to your content to avoid viewer drop-offs.
Balancing CTR and watch time ensures your video performs well in YouTube’s algorithm, driving both clicks and sustained engagement.
What is CTR and How Thumbnails Affect It
What CTR Means and Why It Matters
CTR, or Click-Through Rate, measures how effective your thumbnail and title are at attracting clicks. The formula is simple: (Clicks ÷ Impressions) × 100. An impression is counted when at least 50% of your thumbnail is visible on-screen for at least one second.
"CTR is the first gate. If nobody clicks your video, the other metrics never get a chance to matter." - NLO SMM Team
This metric is crucial because it reflects the initial appeal of your content. On YouTube, the average CTR falls between 4–6%, with roughly half of all channels landing in the 2–10% range. A small improvement in CTR - just 3–5% - can push your video up by 5–15 positions in search rankings. In short, CTR acts as the first filter in determining whether your video gets seen at all.
Now, let’s dive into how thumbnails play a direct role in improving CTR.
How Thumbnails Increase CTR
Thumbnails are the visual hook that grabs attention and encourages clicks. They serve as a promise to viewers, setting expectations that your video must meet to maintain viewer retention. Different thumbnail use cases require unique visual approaches to achieve this. The design of your thumbnail can make or break its effectiveness, with specific elements driving measurable increases in CTR.
For example, clear human faces showing strong emotions can increase CTR by 25–50% compared to thumbnails without faces. Simplicity is another key factor. Thumbnails overloaded with more than three competing elements tend to have a 23% lower CTR, while those with concise text - fewer than four words - can see a 30% higher CTR than text-heavy designs.
One powerful technique is leveraging the "Curiosity Gap." This involves creating a thumbnail that teases information - like showing a "before" without an "after" or posing a question without providing the answer. This psychological tactic compels viewers to click and satisfy their curiosity. Since over 70% of YouTube views come from mobile devices, thumbnails need to be legible at smaller sizes, roughly 120×68 pixels. Using high-contrast color combinations, such as yellow on black or red against cooler tones, helps your thumbnail pop in crowded feeds.
Creators also emphasize the importance of pairing thumbnails and titles strategically. According to ThumbnailGrader, "A great thumbnail + a great title that both say the same thing = wasted real estate". Instead, the thumbnail should visually complement the title, offering additional context or sparking curiosity without redundancy.
sbb-itb-b59debf
What is Watch Time and How Thumbnails Affect It
What Watch Time Means and Why It Matters
Watch time refers to the total amount of time viewers spend watching your video. While the click-through rate (CTR) shows how often people click on your video, watch time reveals whether they actually stick around.
YouTube has made it clear that watch time plays a major role in its discovery algorithm. As Eric Meyerson, Head of Content Creator Communications at YouTube, stated:
"Now when we suggest videos, we focus on those that increase the amount of time that the viewer will spend watching videos on YouTube, not only on the next view, but also successive views thereafter."
This metric is a strong indicator of viewer satisfaction. When watch time is high, it tells the algorithm that people find your content engaging, which in turn boosts your video's visibility in search results and suggested video sections.
To put things into perspective, YouTube users collectively watch over 4 billion hours of video every month. Plus, if you're aiming to join the YouTube Partner Program, you'll need to hit 4,000 watch hours within a 12-month period.
Now, let’s explore how a well-matched thumbnail can keep viewers watching longer.
Matching Thumbnails to Content for Better Retention
While CTR helps get viewers to click on your video, retaining them depends on how well your thumbnail aligns with the actual content. A thumbnail sets expectations, and your video needs to meet them. When thumbnails accurately reflect the content, viewers are more likely to stay engaged. But if there's a disconnect, viewers often leave right away.
A high CTR paired with low watch time is usually a sign of clickbait. Rutvik Shirude, Co-Founder of GrowthOS, explains:
"Clickbait thumbnails might earn short-term clicks, but they tank retention. Low retention signals YouTube to stop recommending the video, which means the initial CTR boost actually hurts your long-term reach."
For example, in November 2025, GrowthOS ran a thumbnail A/B test on the WONE channel with a video titled "Tahawwur Rana is the Mastermind of 26/11 Mumbai Attack." They tested a A/B testing vs gut feeling by comparing a traditional news-style thumbnail against a bold design featuring close-up faces. Within 24 hours, the bold thumbnail captured 59.4% of the watch time share, compared to 40.6% for the news-style version. YouTube then prioritized the bold thumbnail for maintaining viewer interest.
To keep viewers engaged, it’s crucial to deliver on your thumbnail's promise within the first 30% of your video. If viewers click expecting one thing but find something entirely different, they’ll leave almost immediately. To pinpoint this issue, use YouTube Studio’s audience retention reports to spot early drop-offs, which often indicate a mismatch between your thumbnail and your video's opening.
Mastering YouTube’s Algorithm: Clicks, Time, & Retention
CTR vs. Watch Time: How They Compare
CTR vs Watch Time: YouTube Thumbnail Performance Metrics Comparison
Let’s dive into how Click-Through Rate (CTR) and watch time stack up against each other. These two metrics may seem like rivals, but they actually work hand-in-hand to shape your video's performance on YouTube.
Side-by-Side Metric Comparison
CTR measures how well your thumbnail grabs attention, while watch time reveals how engaging and satisfying your content is. Both metrics are critical for YouTube's recommendation system, but they serve different purposes.
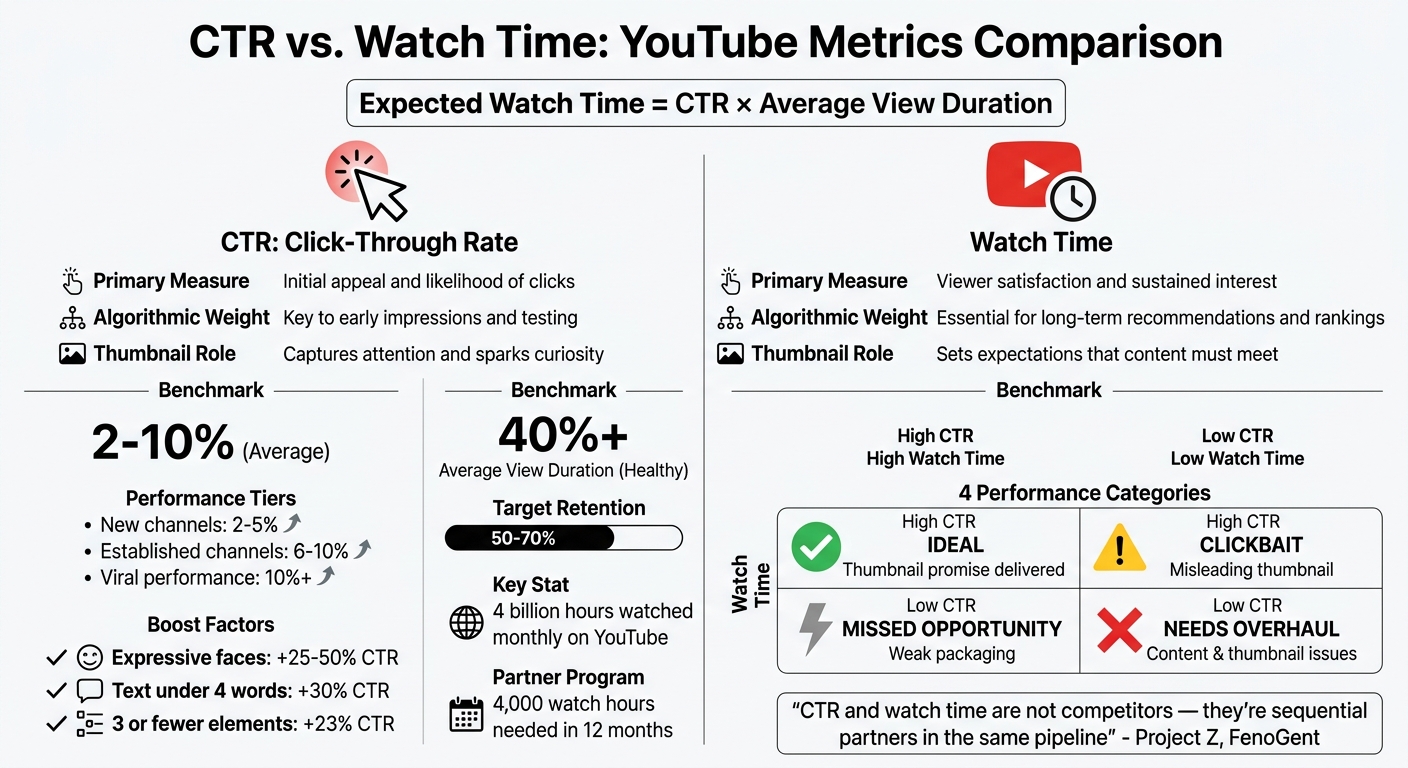
| Feature | Click-Through Rate (CTR) | Watch Time |
|---|---|---|
| Primary Measure | Initial appeal and likelihood of clicks | Viewer satisfaction and sustained interest |
| Algorithmic Weight | Key to early impressions and testing | Essential for long-term recommendations and rankings |
| Thumbnail Role | Captures attention and sparks curiosity | Sets expectations that the content must meet |
| Benchmark | 2–10% (Average) | 40%+ Average View Duration (Healthy) |
So, while CTR gets viewers in the door, watch time determines whether they stay and come back for more.
As Project Z, Founder of FenoGent, highlights:
"CTR and watch time are not competitors - they're sequential partners in the same pipeline".
CTR Measures Initial Appeal
CTR is all about that first impression - whether your AI-generated thumbnails and titles can stop someone mid-scroll. For new uploads, YouTube places heavy importance on CTR during the first 48 hours, making it a key metric in this critical window.
- Newer channels often see CTRs between 2–5%, while more established channels trend higher, around 6–10%.
- Thumbnails featuring expressive human faces can increase CTR by 20–30%.
- A CTR exceeding 10% is considered a viral-level performance.
But here’s the thing: a high CTR doesn’t guarantee success. If viewers click but quickly leave, your video won’t perform well in the long run.
Watch Time Measures Viewer Engagement
While CTR gets people to click, watch time measures whether they actually enjoy your content. It’s YouTube’s way of ensuring that your video delivers on the promise made by your thumbnail and title. The platform calculates "expected watch time per impression" using the formula CTR × Average View Duration.
Quality matters here. As ThumbnailGrader explains:
"A 15% CTR on a video where people bounce after 30 seconds is worse than a 5% CTR where people watch 8 minutes".
In other words, a high CTR paired with low watch time signals that your video might be misleading or unsatisfying. This can lead to fewer impressions over time.
For strong performance, aim for retention rates of 50–70%. If viewers are leaving early, it’s a clear sign that your content isn’t meeting their expectations - something no amount of clicks can fix.
4 Performance Categories for Thumbnail Analysis
To better understand how your thumbnails are performing, you can classify your videos into four distinct categories. Each category highlights a different aspect of thumbnail effectiveness and provides insights into what’s working - and what’s not.
High CTR + High Watch Time
This is the ideal scenario. When both Click-Through Rate (CTR) and Watch Time are strong, it means your thumbnail captured attention and your content delivered on its promise. YouTube’s algorithm responds positively to this combination because it reflects viewer satisfaction.
As TubeAI Learn explains:
"The thumbnail is a promise. Your content is the delivery. Both must align for the system to work in your favor".
Analyze the elements that made this combination successful - colors, facial expressions, or text design. These are your winning strategies, so make them a blueprint for future thumbnails.
High CTR + Low Watch Time
This combination often signals clickbait. Your thumbnail grabbed attention, but viewers didn’t stick around, likely feeling misled. When the algorithm detects this mismatch, it will stop promoting your video.
The solution isn’t to tone down your thumbnail but to make it more authentic. Ensure the energy and promise in your thumbnail match what viewers will experience in the first 30 to 60 seconds of the video. For example, if your thumbnail conveys excitement or surprise, your content needs to deliver that same vibe immediately.
On the flip side, even great content can struggle if it’s paired with a weak thumbnail.
Low CTR + High Watch Time
This is a missed opportunity. Your content is engaging, but the thumbnail isn’t enticing enough to drive clicks.
Here, the issue lies in presentation. Your priority should be to redesign the thumbnail to better reflect the quality of your content. Consider making it more visually striking - use bold colors, expressive faces, or simplified text. A helpful trick is the "10% zoom test": shrink your thumbnail to a smaller size and check if its core message still stands out.
Finally, when both metrics are low, it’s a sign of deeper issues.
Low CTR + Low Watch Time
This category indicates that both your thumbnail and content need a serious overhaul.
Start by revisiting the video concept itself. As Rutvik Shirude, Co-Founder of GrowthOS, advises:
"If you cannot think of a compelling thumbnail-title pair, the video idea may not be strong enough to earn clicks".
While redesigning the thumbnail is important, also take a hard look at your video’s intro and overall structure. Sometimes, the problem isn’t just in how you’re presenting the video - it’s in the content itself.
These four categories provide a clear framework to evaluate and improve both your thumbnails and your content strategy, helping you build a stronger presence on YouTube.
Why Watch Time Matters More for Long-Term Success
CTR might get viewers to click on your video, but watch time is what convinces YouTube to keep promoting it. If viewers click but quickly leave, it signals to YouTube's algorithm that your content isn't delivering on its promise. This balance between clicks and engagement is essential to understanding how YouTube evaluates videos.
How YouTube's Algorithm Prioritizes Watch Time
YouTube's algorithm revolves around a metric called "expected watch time per view", which combines CTR with average view duration. In simple terms, videos that keep viewers engaged for longer - even with a moderate CTR - are more likely to succeed than those with high CTR but poor retention. If viewers drop off early, it suggests a mismatch between what the thumbnail or title promises and what the video delivers.
The first 48 hours after uploading - often referred to as the 48-Hour Rule - are especially critical. During this time, CTR helps get the video noticed, but sustained watch time determines whether YouTube will push it to a wider audience. It's also worth noting that YouTube prioritizes total minutes watched over percentage retention. For example, a longer video with slightly lower retention can outperform a shorter one if it generates more total watch time.
How to Optimize for Both CTR and Watch Time
To succeed, you need to treat CTR and watch time as complementary goals. Start with a thumbnail that grabs attention but accurately reflects the video’s content. This ensures that viewers stay engaged once they click. The "Promise and Delivery" framework is key - your thumbnail should create curiosity that the video immediately satisfies.
Use YouTube’s A/B testing tools, like the "Test & Compare" feature, or compare thumbnail tools to experiment with different designs. Let each variation reach around 1,000 impressions to see which one balances clicks and engagement. Dive into your retention graphs in YouTube Studio, focusing on the first 30 seconds. A sharp drop-off may indicate that your thumbnail or title overpromised. On the other hand, if retention is strong but CTR is low, focus on improving how your video is packaged.
Analyzing top-performing videos monthly can also reveal trends in thumbnail design - like effective color schemes, facial expressions, or text placement - that you can incorporate moving forward. Tools like ThumbnailCreator make this process easier by streamlining design and testing.
How ThumbnailCreator Helps Optimize Both Metrics
ThumbnailCreator is a tool designed to simplify thumbnail creation while maximizing both CTR and watch time. Its AI-driven design process uses the "Rule of Three", which focuses on one face, one object, and concise text. This approach avoids clutter and helps prevent the typical 23% drop in CTR caused by overly busy thumbnails.
The platform also includes features like face swapping and object swapping, allowing you to test different visual styles. For instance, expressive faces can boost CTR by 20% to 50%. Its text editing tools help keep thumbnails concise, often leading to CTR increases of around 30% compared to text-heavy designs.
With mobile-preview simulators, you can ensure your thumbnails remain clear and effective on smaller screens. Plus, the tool’s template library - based on patterns from successful videos - helps you design thumbnails that not only attract clicks but also align with your content, reducing the risk of misleading viewers and losing engagement.
Conclusion
When comparing CTR (Click-Through Rate) and watch time for thumbnail effectiveness, it’s clear that these two metrics work hand in hand to drive YouTube growth. CTR gets viewers to click, while watch time ensures your content keeps them engaged. When both metrics perform well together, YouTube’s algorithm rewards your channel with increased reach and steady visibility.
Every thumbnail carries an unspoken promise - it hints at the value your video offers. As Rutvik Shirude, Co-Founder of GrowthOS, wisely states:
"The real job of your thumbnail is to increase meaningful watch time, not just make the YouTube CTR graph look good".
A high CTR alone isn’t enough. It only matters if viewers stick around, as YouTube prioritizes "expected watch time per impression" - a combination of CTR and average view duration.
Dive into your performance metrics to identify patterns. For instance, a high CTR with low watch time might suggest clickbait vs authentic thumbnails issues, while low CTR paired with strong retention could mean your content is great but not packaged effectively. Regularly reviewing your top-performing videos can help uncover what’s working and what needs improvement.
Experiment with different thumbnail elements using tools like YouTube’s A/B testing or ThumbnailCreator. Test aspects like facial expressions, text placement, or color schemes, and ensure each test runs until at least 1,000 impressions for reliable results. Also, preview thumbnails at smaller sizes - over 70% of views come from mobile, so clarity matters.
Start refining your thumbnails today. By combining visual appeal with content that delivers, you can create a winning formula for long-term YouTube success.
FAQs
What’s a good CTR for my channel size?
A strong click-through rate (CTR) for your channel usually falls between 4% and 5%, with 6% or higher being outstanding and anything over 10% considered exceptional. However, these numbers can shift depending on your niche and the type of content you create.
How can I tell if my thumbnail is causing low watch time?
If your video has a high click-through rate (CTR) but a low average view duration (AVD), your thumbnail might be sending the wrong message. Take a look at the audience retention metrics - if viewers are leaving shortly after clicking, it’s a sign that your thumbnail doesn’t align with the actual content of the video.
Compare your retention data with the CTR: when retention is low but CTR is high, it usually means the thumbnail is either drawing in the wrong audience or creating expectations the video doesn’t fulfill.
How long should I run a thumbnail A/B test to trust the results?
For the most reliable outcomes, it's best to run a thumbnail A/B test for at least 24 hours. This time frame allows you to gather enough data to identify patterns and trends while accounting for fluctuations in viewer behavior throughout the day.