
5 Steps to Analyze Thumbnail CTR in YouTube Studio
Your YouTube thumbnail directly impacts how many viewers click on your video. Click-Through Rate (CTR) measures this impact, showing the percentage of people who click after seeing your thumbnail. A strong CTR signals engaging content, helping YouTube promote your videos to a larger audience.
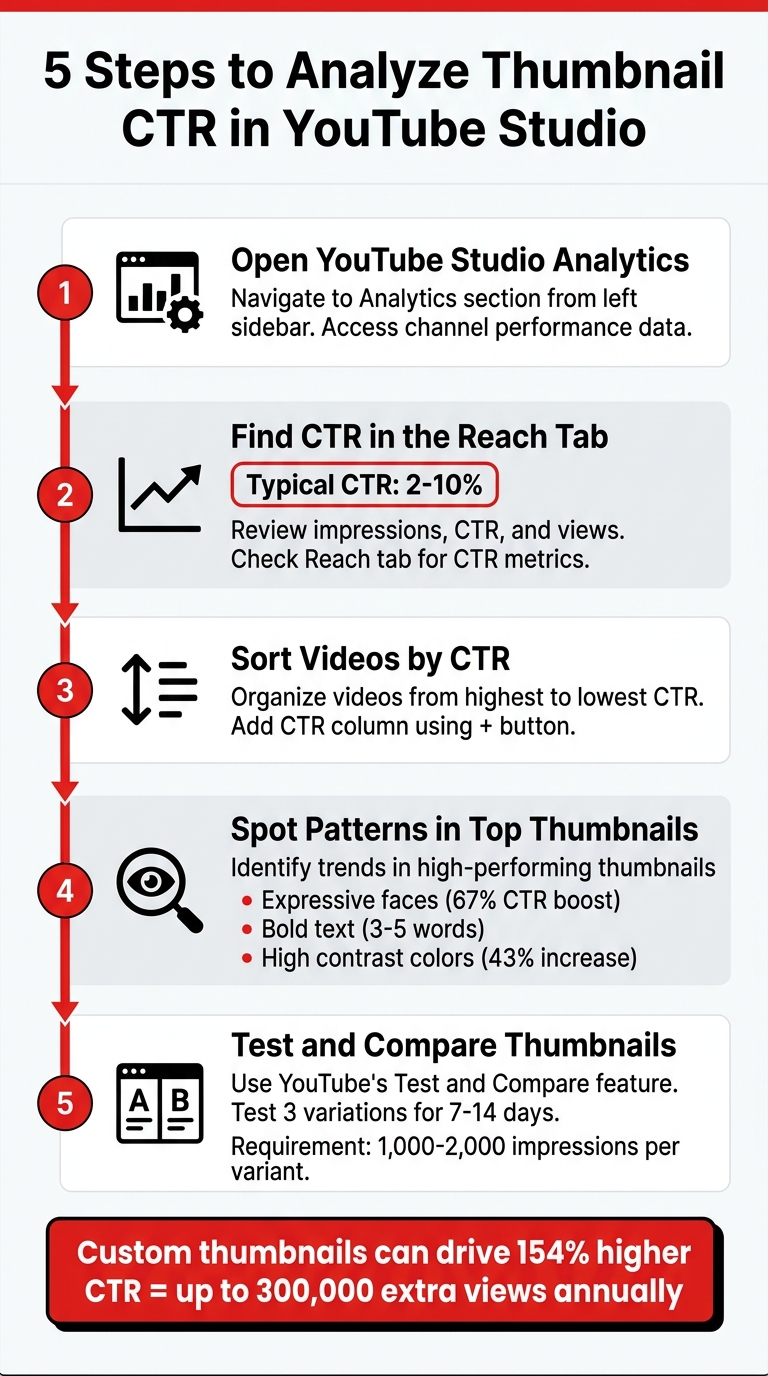
Here’s how you can analyze and improve your thumbnail performance in YouTube Studio:
- Open YouTube Studio Analytics: Access your channel’s performance data by navigating to the Analytics section.
- Find CTR in the Reach Tab: Review impressions, CTR, and views to assess how well your thumbnails attract clicks.
- Sort Videos by CTR: Identify your best-performing thumbnails by comparing data-driven results and organizing videos from highest to lowest CTR.
- Spot Patterns in Top Thumbnails: Look for trends - like colors, text, or facial expressions - that drive clicks.
- Test and Compare Thumbnails: Use YouTube’s testing feature to experiment with different designs and refine your strategy.
CTR benchmarks vary by channel size, but a CTR between 2% and 10% is typical. High-performing thumbnails often feature expressive faces, bold text, and vibrant colors. Use these insights to create thumbnails that resonate with your audience and boost engagement.
5 Steps to Analyze YouTube Thumbnail CTR in YouTube Studio
Step 1: Open YouTube Studio Analytics
How to Open YouTube Studio
To get started, log in to YouTube and click on your profile picture in the top-right corner. From the dropdown menu, select YouTube Studio. This will take you to the dashboard where you can explore your channel's performance metrics.
How to Find the Analytics Dashboard
Once you're in YouTube Studio, locate the Analytics option in the left-hand sidebar and click on it. This will open the main analytics dashboard.
If you’re looking for overall channel performance, head to the Content tab at the top of the screen. This section will show you aggregated data, including impressions and click-through rates (CTR) for all your videos. If you want to review the performance of a specific video, follow these steps:
- Click Content in the left-hand menu.
- Hover over the video you're interested in.
- Click the Analytics icon that appears.
- Navigate to the Reach tab.
The Reach tab is where you’ll find a key metrics card displaying both impressions and the impressions click-through rate. This is the exact data you need to assess how well your thumbnails are performing. To see how you compare, check out these thumbnail CTR benchmarks for different niches. Keep in mind that CTR data is updated within hours, but it’s best to check after your video has accumulated a sufficient number of impressions for accurate insights.
| Navigation Level | Menu Path | Primary Tab for CTR |
|---|---|---|
| Channel Level | Analytics (Left Menu) | Content (Top Menu) |
| Video Level | Content (Left Menu) > [Video] > Analytics | Reach (Top Menu) |
sbb-itb-b59debf
Step 2: Find Your Impressions Click-Through Rate
Understanding the Reach Tab
In the Reach tab of YouTube Studio, you'll find three key metrics: Impressions (the number of times your thumbnail is displayed, with at least 50% visible for over a second), Views from impressions (how many views came from those impressions), and the impressions click-through rate (CTR), which measures how well your thumbnail and title attract clicks.
For context, about half of YouTube channels see a CTR between 2% and 10%. If your channel has fewer than 10,000 subscribers, a CTR of 1–3% is typical, while hitting 5% or more is a strong result. Larger channels with over a million subscribers often achieve CTRs between 6% and 10%, thanks to their established audience trust and recognition. These benchmarks help evaluate how effective your thumbnails are and identify thumbnail mistakes to avoid.
CTR is a key indicator of how engaging your thumbnail appears. A high CTR tells YouTube that your video is appealing, which can lead to increased reach. However, keep an eye on both CTR and impressions together. If CTR dips while impressions grow, it usually means your video is reaching a broader audience beyond your usual viewers.
Before diving deeper, adjust your date range to analyze the most relevant timeframe for your video.
How to Change the Date Range
To change the date range, use the date picker in the top-right corner of the analytics dashboard in YouTube Studio. For new videos, focus on a 14-day window to track how your CTR stabilizes as impressions grow. Avoid checking CTR right after uploading a video - wait until you’ve accumulated at least 1,000–2,000 impressions for more reliable data.
Different timeframes can offer valuable insights. For example, CTR tends to peak during March–May, September–October, and November–December, while January usually sees a decline due to post-holiday browsing patterns. Comparing the last 7 days with the previous 28 days can help identify trends and evaluate whether recent thumbnail updates are effective. If you’re experimenting with a new thumbnail design, give it at least 7–14 days before drawing any conclusions.
The Thumbnail Experiment: Using Science to Boost CTR
Step 3: Sort Your Videos by CTR
Once you’ve gathered CTR data, the next step is to organize your videos to identify which thumbnails are driving clicks effectively.
How to View Top Videos in Analytics
To start, head over to YouTube Studio and navigate to the Overview tab. This section gives you a quick snapshot of your channel’s performance, including Realtime and Typical performance reports. If you want to dive deeper and analyze specific videos, click See More on any analytics card. This will open a detailed metrics table.
For more granular insights, go to the Content tab, select a specific video, and click the Analytics icon. From here, you’ll be able to sort your videos by CTR to evaluate how well individual thumbnails are performing.
How to Sort Videos by CTR
In the expanded metrics table, click the + button at the top to add additional metrics. Under the Reach category, choose Impressions click-through rate. Once the column is added, click the Impressions click-through rate header to sort your videos from highest to lowest CTR.
This method allows you to identify the thumbnails and titles that are capturing the most clicks. Compare the top and bottom five videos by CTR and look for patterns. Pay attention to elements like color schemes, facial expressions, and text clarity. For instance:
- Thumbnails with human faces vs. those without often show significant performance gaps, with faces generating 20–40% higher CTRs in many cases.
- High-contrast colors like red, yellow, and orange tend to outperform muted tones by 8–12% in 80% of tests.
However, don’t just focus on CTR alone. Always consider Average View Duration (AVD) alongside CTR. A high CTR paired with a low AVD might indicate that your thumbnails are misleading or not aligned with the video content.
Step 4: Find Patterns in Your Best Thumbnails
Once you've sorted your thumbnails by CTR, it's time to figure out what makes your best ones stand out. This isn't about making educated guesses - it's about identifying clear, repeatable trends that consistently grab attention and drive clicks.
What Makes Thumbnails Get More Clicks
Take a close look at your top three and bottom three thumbnails. Compare them side by side, focusing on elements like facial expressions, background colors, and the amount of text used.
Expressive faces are a game-changer. In 2022, productivity creator Ali Abdaal ran a 21-day test with 127,000 impressions to see how facial expressions affected CTR. His results? A surprised expression with direct eye contact hit a 9.4% CTR, while a neutral, professional look only managed 6.8%. That’s a 67% boost in clicks, simply by using strong, engaging facial emotions.
"Faces - particularly eyes - are magnet fixation points that attract attention in cluttered visual environments." - Marcus Chen, YouTube Optimization Consultant
Text legibility is another critical factor. The best thumbnails use short, bold text - just 3 to 5 words - with clean, sans-serif fonts to ensure they’re easy to read on mobile devices. For example, a personal finance channel tested two versions of a thumbnail for a credit score video. The shorter text ("Credit Score Mistake") achieved an 8.91% CTR, while the longer version ("The Hidden Factor Destroying Your Credit Score") only reached 7.43%. Since 70% of YouTube watch time happens on mobile devices, keeping text simple and bold is essential.
Visual contrast also plays a major role. High-contrast text can increase CTR by 43%, and using bright, saturated colors like purple, orange, or neon green can boost it by 34%. However, cluttered designs hurt performance - CTR drops by 28% with overly busy layouts, and dark or low-contrast thumbnails can reduce clicks by 41%. The key? Stick to one clear subject or visual focus - too much going on can drive viewers away.
Armed with this knowledge, you can start recreating the elements that make your top thumbnails successful.
Using ThumbnailCreator to Apply What Works
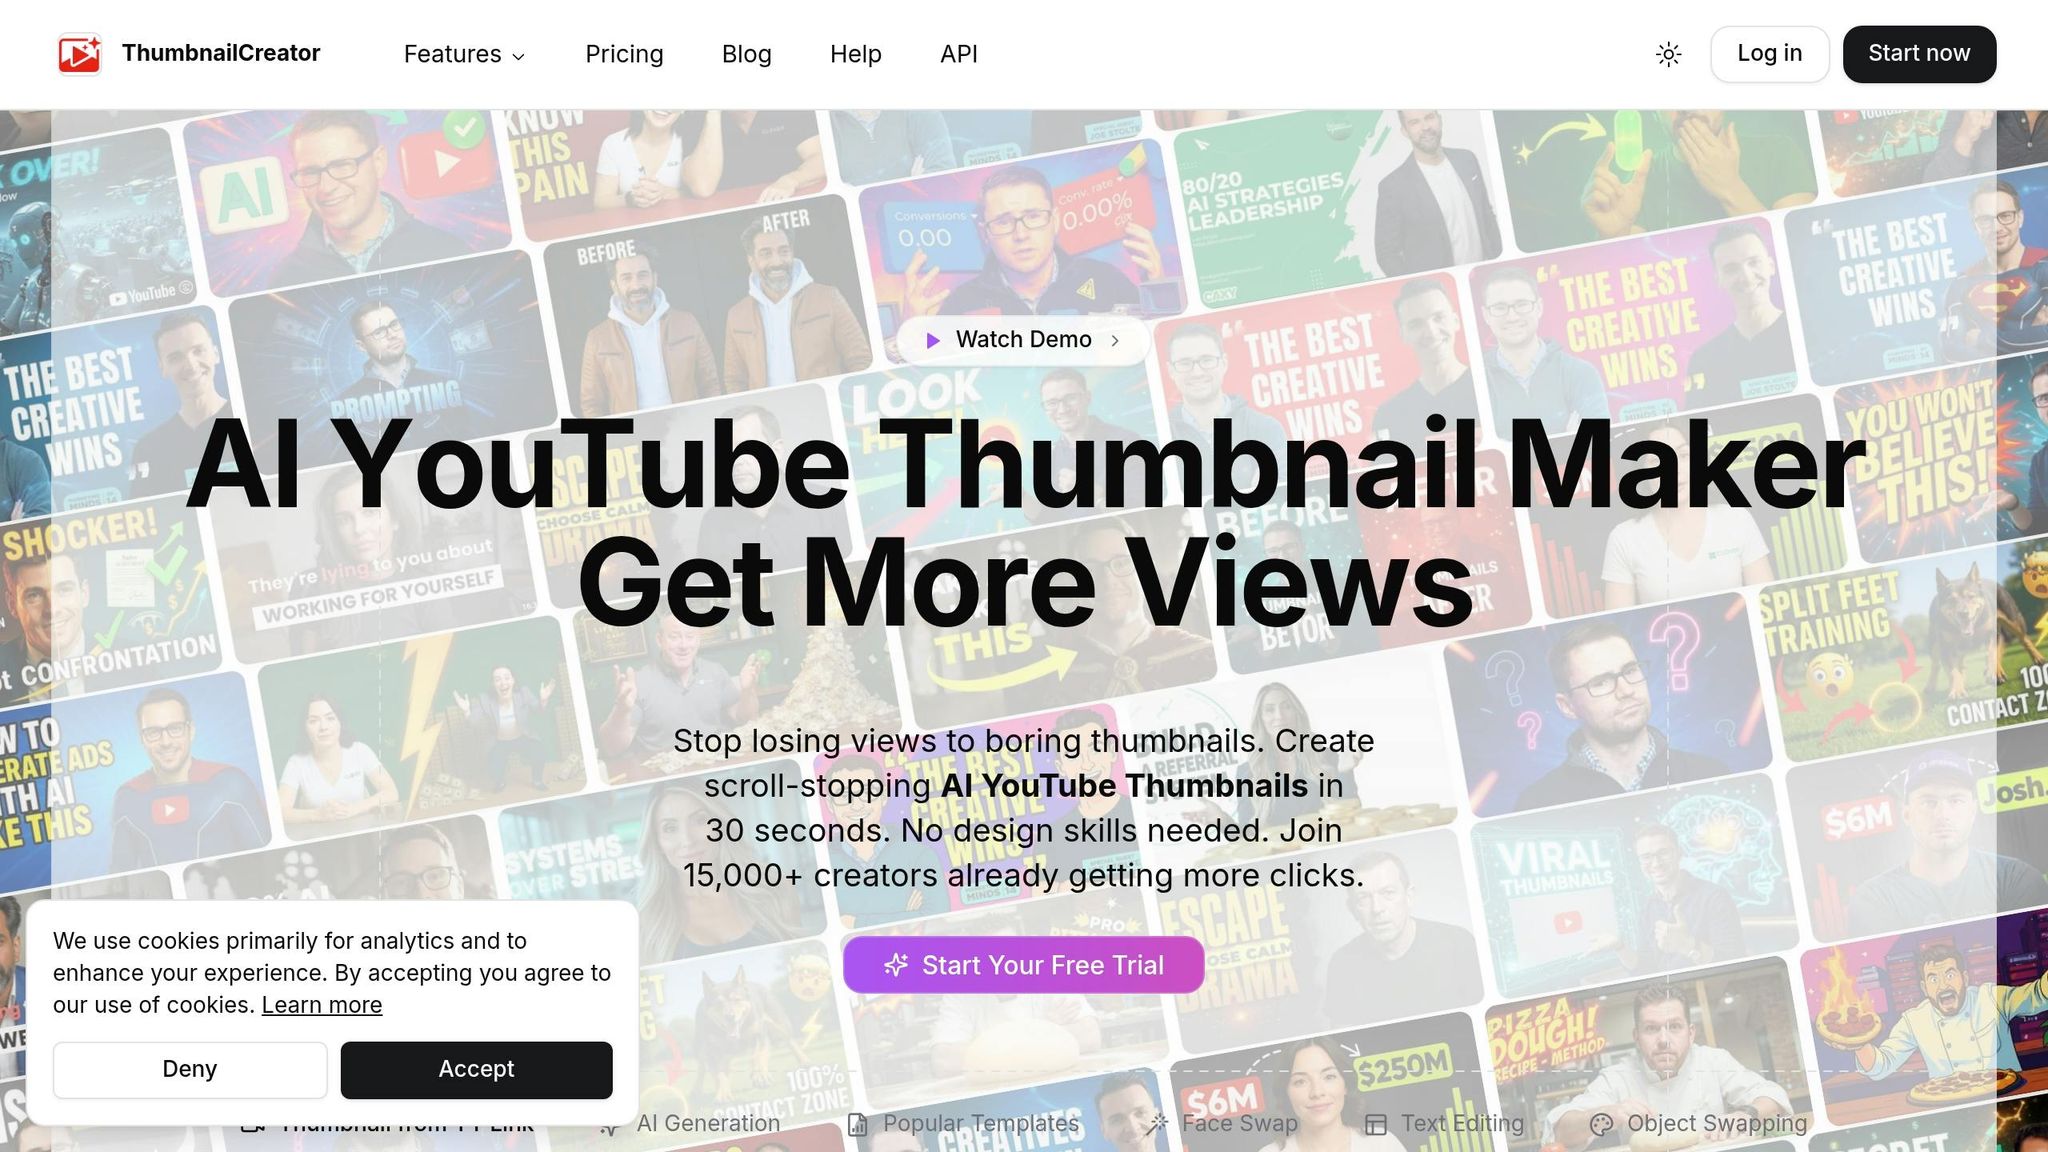
To streamline this process, tools like ThumbnailCreator can help you replicate winning designs. This AI-powered tool analyzes your high-performing thumbnails and recreates key elements like color schemes, focal points, and layouts. It saves time and ensures your new thumbnails follow proven strategies.
ThumbnailCreator also includes text tools designed for bold, high-contrast fonts like Montserrat, Impact, or Bebas Neue, making sure your text is crystal clear on mobile screens. You can even use its "Blur & Pop" feature, which desaturates the background to make your main subject stand out. Plus, it helps you avoid design pitfalls like placing key elements in the bottom-right corner, where YouTube’s duration overlay can obscure them.
Templates are another handy feature. They help you maintain consistent thumbnail branding, which can increase CTR from returning subscribers by 15–20%. When viewers instantly recognize your thumbnails, they’re more likely to click - especially when your style is based on data from your own analytics.
Step 5: Test Different Thumbnails
Once you've figured out what resonates with your audience, it's time to test various thumbnails to fine-tune your click-through rate (CTR) and viewer engagement. YouTube Studio offers a handy "Test and Compare" feature that allows you to upload up to three thumbnail options for a single video. This tool evaluates performance based on watch time per impression, prioritizing thumbnails that successfully draw in engaged viewers.
How to Set Up Thumbnail Tests
To get started, head to the "Content" tab in YouTube Studio. Select your video, click on the thumbnail section, and choose "Test and Compare". Upload up to three thumbnail variations, and YouTube will show these to different segments of your audience simultaneously. The platform tracks which thumbnail generates the most watch time per impression.
For dependable results, aim for each thumbnail variant to receive between 1,000 and 2,000 impressions. Ideally, tests with 10,000+ total impressions deliver the most reliable insights. Let the test run for at least 7 to 14 days to capture both weekday and weekend audience behaviors. Avoid ending the test too soon, as early data often skews toward your subscriber base.
"The biggest mistake creators make is calling a test after 100 clicks. You need at least 1,000 impressions per variation for statistically meaningful results." - Tim Schmoyer, Founder, Video Creators
When testing, focus on bold, contrasting ideas rather than small tweaks. For example, compare different thumbnail design styles like a close-up face versus a product shot or a text-heavy thumbnail with one that's image-only. A good strategy is the "Safe-Safe-Wildcard Method": include one thumbnail in your usual style, one with a slight variation, and one that's completely experimental. This approach helps you uncover new, effective designs while holding onto proven methods. And remember - test thumbnails and titles separately to avoid muddying the results.
After the test concludes, plan to revisit thumbnail designs regularly to stay aligned with changing audience preferences. If you are just starting out, following a YouTube thumbnail beginners guide can help you establish a strong baseline before you begin advanced testing.
When to Retest Your Thumbnails
Viewer tastes change over time, so it's smart to retest thumbnails every three months or after significant updates to your content. This helps maintain high CTRs and keeps your visuals appealing. Older "evergreen" videos that still draw consistent views are great candidates for thumbnail refreshes. Updating their thumbnails can breathe new life into their performance and sustain traffic over the long run.
Once YouTube determines a "Winner", the platform will automatically set that thumbnail as the default for all viewers. If the result is "Performed Same" (no clear winner), go with the design you personally prefer. For "Inconclusive" results (insufficient data), the original thumbnail remains the default. Either way, you'll walk away with actionable insights to guide your next round of designs.
Conclusion
Digging into thumbnail CTR using YouTube Studio can turn educated guesses into actionable insights. By following the outlined steps - checking your impressions click-through rate, sorting videos by CTR, spotting YouTube thumbnail trends in top-performing designs, and experimenting with new designs - you can transform viewer clicks into real channel growth. This process helps signal to YouTube that your content is worth promoting.
Custom thumbnails that are well-optimized can make a massive difference. For instance, they can drive a 154% higher CTR, which could mean as many as 300,000 extra views annually and up to $3,000 in additional revenue for a channel with 50,000 subscribers. High-CTR thumbnails don’t just attract more clicks - they can also increase views by 2.5 times. Plus, videos with these thumbnails often see 67% of their total engagement happen within the first 24 hours, compared to just 31% for videos with low-CTR thumbnails.
This data underscores the value of every single click.
"CTR is your audience's first vote of confidence. When viewers click, they're telling YouTube, 'Yes, this is what I was looking for!'" - Thumbnail Scout
But it’s not just about chasing clicks - balancing a high CTR with strong Average View Duration is key to avoiding misleading your audience.
Ready to refine your thumbnail strategy? Tools like ThumbnailCreator can simplify the process. This AI-powered platform uses proven elements - like expressive faces, bold text, and vibrant colors - to help you design thumbnails that align with your CTR analysis, even if you’re not a design expert.
FAQs
Why is my CTR dropping even though impressions are rising?
If your impressions are climbing but your CTR is falling, it could mean your thumbnails or content aren't aligning with what viewers expect. Another possibility is that YouTube is showing your videos to a broader audience that's less interested in your niche.
To tackle this, focus on creating thumbnails that work well on mobile devices, clearly reflect your video content, and grab attention in busy feeds. Experimenting with different designs and making adjustments over time can also help fine-tune your approach.
How many impressions do I need before CTR data is reliable?
CTR data tends to become more dependable after about 14 days and a substantial number of impressions. Waiting this long allows for statistically meaningful results, offering a more accurate understanding of how well your thumbnail is performing.
Should I change my thumbnail if CTR is high but watch time is low?
If your thumbnail has a high click-through rate (CTR) but viewers aren't sticking around, it might be because the thumbnail doesn't align with what the video delivers. This mismatch can leave viewers disappointed, leading to early drop-offs. To address this, make sure your thumbnail accurately represents the content of the video and sets clear expectations.
You can also take advantage of YouTube Studio's A/B testing feature. This tool lets you test different thumbnail designs to see which one not only grabs attention but also attracts viewers who stay engaged with your content longer.