
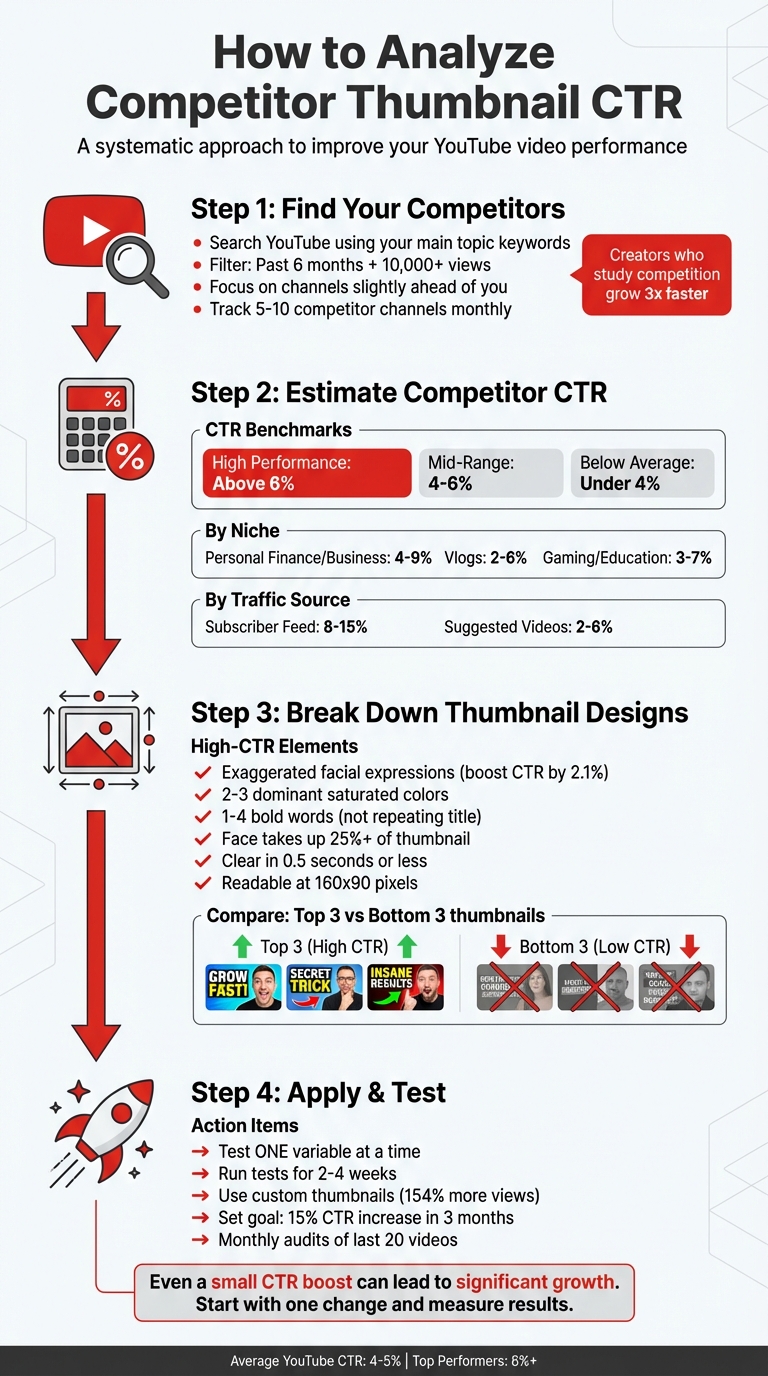
How to Analyze Competitor Thumbnail CTR
To improve your video performance on YouTube, analyzing competitor thumbnails is key. Thumbnails are the first thing viewers notice, and their click-through rate (CTR) directly impacts your video’s reach. Here's a quick breakdown:
- Thumbnail CTR measures how many viewers click on your video after seeing its thumbnail. A CTR above 6% is considered high-performing.
- Study competitors' thumbnails to identify patterns like colors, facial expressions, and layouts that drive clicks.
- Focus on competitors slightly ahead of you in your niche. Analyze their most-viewed videos to estimate their CTR and pinpoint effective design elements.
- High-CTR thumbnails often feature exaggerated emotions, bold colors, minimal text, and clear subject focus.
- Perform thumbnail A/B testing to refine your designs based on these insights, using tools like ThumbnailCreator for quick design adjustments.
Key Tip: Start small - test one variable (e.g., color or text) at a time over a few weeks to see what works best. Even a small CTR boost can lead to significant growth.
4-Step Process to Analyze Competitor Thumbnail CTR on YouTube
Step 1: Find Your Competitors and Their Videos
How to Find Competitors in Your Niche
To improve your thumbnail click-through rate (CTR), start by identifying competitors who are successfully engaging your target audience. A good way to do this is by searching YouTube using your main topic keywords - these are the same terms your audience is likely typing into the search bar. Once you get the results, use YouTube's built-in filters. Set the "Upload Date" to the past six months and filter for videos with over 10,000 views. This will help you zero in on trending content in your niche.
Focus on channels that are slightly ahead of you in terms of growth and post content regularly - at least once a week. Channels that are too small might not provide enough data to analyze, and those that are significantly larger often operate under different circumstances. Ideally, you want to study competitors who are just one or two steps ahead of you and cater to the same audience.
Here's an interesting fact: creators who consistently study their competition grow three times faster than those who don’t. To stay organized, keep a spreadsheet updated monthly with 5–10 competitor channels, tracking key metrics like upload frequency, average views, and engagement levels.
Choose Which Videos to Analyze
Focus your analysis on the best-performing videos from your competitors. Look for videos with views that are significantly higher than the channel's average. A like-to-view ratio above 5% is also a strong indicator of high engagement.
To get meaningful insights, analyze a sample of 10–20 top-performing videos from each competitor. Compare their top 10 videos with their bottom 10. This side-by-side comparison will help you identify patterns in thumbnail design - things like text style, color schemes, or facial expressions - that seem to drive higher CTRs.
As YouTube strategist Paddy Galloway puts it:
"Every video I make is influenced by studying what worked for others. But I always add my unique angle. That's the difference between learning and copying."
Compare your findings against thumbnail CTR benchmarks to see how they stack up. Take these observations and use them to estimate CTR as you move into the next step.
sbb-itb-b59debf
Step 2: Estimate Competitor Thumbnail CTR
YouTube CTR Benchmarks Explained
Knowing what qualifies as a "good" click-through rate (CTR) helps you assess how competitors are performing. In 2026, typical CTRs range between 2% and 10%, with an average of 4%–5%. These figures vary significantly depending on the niche, traffic source, and audience size.
Thumbnails with strong performance often achieve a CTR above 6%. These tend to feature bold emotions, bright contrasting colors, and minimal text. Mid-range performance generally falls between 4% and 6%, which is respectable for established channels. Anything below 4% usually points to issues with either the thumbnail design or how well the topic resonates with the audience.
CTR ranges can differ based on the content type. For example:
- Personal finance and business topics often hit 4% to 9%.
- Vlogs typically see 2% to 6%.
- Gaming and educational videos usually fall between 3% and 7%.
Traffic sources also play a big role. Videos appearing in a subscriber feed often achieve 8% to 15% CTR since subscribers already trust the creator. On the other hand, suggested videos usually have a lower range of 2% to 6% because viewers are already engaged with other content.
"A 5% CTR on a video that YouTube pushed to millions of people on the home feed is significantly more impressive than a 12% CTR on a video that was mostly seen by your subscribers."
Calculate CTR from Views and Impressions
You won’t have access to competitors’ exact impression data, so you’ll need to estimate their CTR by comparing their video performance to their channel averages. Start by identifying outlier videos - those with far more views than the channel’s typical uploads. These videos likely have CTRs in the 6% to 10% range.
CTR is calculated by dividing views by impressions and multiplying by 100. While you won’t know competitors’ exact impression counts, their view patterns can serve as a useful proxy. For instance, if a video has 200,000 views compared to the channel’s usual 50,000, it’s likely performing well in terms of CTR.
Focus only on videos with at least 1,000 impressions. Smaller sample sizes can lead to misleading conclusions. Keep in mind that CTR naturally declines as videos are shown to broader audiences. For example, a video might start with a 9% CTR from 10,000 impressions (mainly core subscribers) but drop to 3.5% after reaching 100,000 impressions. A declining CTR as impressions increase often reflects broader audience exposure rather than a failure in thumbnail design.
To analyze competitors effectively, group their videos into performance tiers based on how their views compare to their channel average. This approach makes it easier to identify which thumbnails are genuinely driving clicks versus those benefiting from algorithmic boosts or loyal subscribers. These CTR estimates will help you break down the design features that contribute to competitor success in the next step.
Step 3: Break Down Competitor Thumbnail Designs
Common Patterns in High-CTR Thumbnails
Once you've identified competitor videos with strong performance, it's time to dig into what makes their thumbnails click-worthy. High-CTR thumbnails often share distinct visual traits that help them stand out across various niches.
Facial expressions play a huge role. Thumbnails featuring clear, exaggerated emotions - like shock, frustration, or curiosity - tend to outperform those with subtle or neutral expressions. In fact, studies show that including a face with a strong expression can boost CTR by 2.1%. For mobile viewers, make sure the face takes up at least 25% of the thumbnail for better visibility.
Color contrast is another key factor. Winning thumbnails often use 2–3 dominant, highly saturated colors like yellow, red, orange, or electric blue. These colors naturally pop against YouTube's white and dark gray interface . Additionally, the main subject should be noticeably brighter or darker than the background to create a clear visual hierarchy. Since over 70% of YouTube views happen on mobile devices, thumbnails without strong contrast can easily fade into the background.
Text overlays are minimal but impactful. The most successful thumbnails use 1–4 bold, sans-serif words that complement the video title rather than repeating it. These words need to remain legible even at the small size of 160x90 pixels. Overloading the thumbnail with more than five words can overwhelm viewers and hurt CTR.
Visual cues like arrows, circles, and icons can direct attention without overcomplicating the design. Other techniques, such as applying a background blur (using a Gaussian blur with a 4–8 pixel radius) or adding a 4–8 pixel stroke around the main subject, help create depth and separation. These elements ensure the thumbnail communicates its message in under 0.5 seconds, which is about how long you have to grab someone's attention.
To refine your approach, analyze the differences between high-CTR and low-CTR thumbnails to uncover which design features make the biggest impact.
Compare High-CTR and Low-CTR Thumbnails
One of the quickest ways to learn what works is by directly comparing thumbnails. Group competitor videos into three categories based on estimated CTR: high (above 6%), average (4–6%), and low (below 4%). Then, place the top three and bottom three thumbnails side by side to identify the most noticeable differences.
For example, a gaming channel studied by ClickyApps in late 2025 revamped a thumbnail that originally featured a four-character squad. The cluttered design earned a low CTR of 1.8% on mobile. After switching to a simpler design - a single character's face with a shocked expression - the CTR jumped to 4.2% within a week. This shows how a focused design can outperform a busy one.
When comparing thumbnails, pay attention to emotional impact, color brightness, text simplicity, and subject clarity. Low-CTR thumbnails often use dull colors like grays or browns that blend into YouTube's interface . They may also include too much text in thin, hard-to-read fonts or feature multiple subjects competing for attention. In contrast, high-CTR thumbnails focus on one clear subject, use vibrant colors, and keep text minimal and bold.
"If your thumbnail requires more than 0.5 seconds to understand what the video is about, you've lost the click." - FluxNote
Before wrapping up your analysis, run a shrink test. View each thumbnail at 160x90 pixels to check if the text and facial expressions remain clear. If they don’t, the design is likely too complicated. Also, ensure key elements aren’t placed in the bottom-right corner, where the video timestamp can obscure them. This side-by-side comparison not only highlights effective designs but also provides actionable insights for improving your thumbnails in the next step.
The Thumbnail Experiment: Using Science to Boost CTR
Step 4: Apply What You Learned to Your Thumbnails
Take what you’ve uncovered from analyzing competitors and use it to improve your thumbnail designs. This step is all about turning insights into action.
Pick the Right Design Elements for Your Niche
Look closely at what works in your niche. For example, gaming thumbnails often feature dramatic action shots paired with expressive faces, while beauty tutorials tend to highlight close-up shots with products prominently displayed. Your analysis should help you pinpoint which elements connect best with your audience.
To organize your findings, create a comparison matrix that breaks down design elements from high-CTR (click-through rate) and low-CTR videos. Spot patterns in things like color schemes, text styles, or image composition. If you notice competitors using bold typography or high-contrast colors effectively, think about how you can apply those principles while keeping your design unique. For instance, use your own brand colors to create contrast rather than directly copying their style. This way, you’re leveraging successful techniques while staying true to your identity.
When testing new thumbnail ideas, focus on A/B testing vs gut feeling by testing one variable at a time—whether it’s color, text placement, or facial expressions—over 2–4 weeks to give YouTube’s algorithm enough time to distribute impressions fairly. This will provide more reliable data to assess what works. Remember, videos with custom thumbnails attract 154% more views than those using auto-generated ones. The effort you put into refining your thumbnails can have a huge impact.
Before diving into redesigns, establish clear branding guidelines for your thumbnails. Define your color palette, typography, and overall style. These guidelines will help you adapt competitor strategies without losing the distinct look and feel of your channel. Instead of mimicking another creator’s thumbnails, focus on the principles behind their success - like effective use of contrast or compelling text placement - and make them your own.
Once you’ve nailed down your design strategy, it’s time to bring these ideas to life with ThumbnailCreator.
Create Better Thumbnails with ThumbnailCreator
ThumbnailCreator is a great tool to turn your design ideas into reality, even if you’re not a design pro. Its AI-driven features allow you to create high-quality thumbnails quickly, using the patterns you identified during your competitor analysis. Forget spending hours in complex design software - simply input your preferred design elements, like colors and text placement, and generate multiple thumbnail variations in no time.
The platform’s template library is especially handy. For example, if your research shows that thumbnails with expressive faces and bright backgrounds perform well, you can use ThumbnailCreator’s face-swapping feature to test different emotional expressions. The built-in text editing tools also ensure your text remains clear and readable, even at YouTube’s standard 160×90 pixel size.
One of the standout features is batch processing, which makes A/B testing a breeze. You can create several thumbnail variations for each video and use YouTube Analytics to track which design gets the best impression-to-view ratio. This method allows you to validate strategies inspired by your competitor research efficiently. With consistent testing, you could push your CTR beyond the typical 2–10% range and aim for the 15%+ rates achieved by top-performing channels.
Conclusion
Analyzing competitor thumbnail CTR is a process that can take your channel from average performance to real growth. By following a clear approach - starting with competitor research, estimating their CTR, dissecting what makes their thumbnails effective, and applying those insights - you can move away from guesswork and toward a more systematic strategy for improvement.
The key lies in consistent testing and refinement. Even small adjustments can lead to meaningful results over time. For example, creator Nick Nimmin showed how replacing a cluttered thumbnail with a high-contrast, simplified design boosted CTR by 2%. That small change led to a sustained increase in daily views for months after the video was published. These gains aren't just lucky breaks - they come from treating thumbnail optimization as a measurable tool for growth.
"CTR optimization is no longer just a design exercise - it's a measurable growth lever." - Nadica Naceva, Writer, Influencer Marketing Hub
Set clear goals, like increasing your CTR by 15% in three months. Keep track of how different visual elements impact engagement, and use A/B testing to fine-tune your designs. Running these tests for two weeks to a month ensures you account for variations and get statistically solid results. Review your data regularly - monthly audits can help refine your strategy and keep your approach aligned with viewer preferences.
Since audience tastes change over time, it's vital to revisit your thumbnails periodically. Analyze the last 20 videos to identify patterns and redesign the thumbnails for your top 10 highest-traffic videos. Tools like ThumbnailCreator can simplify the design process, letting you focus on strategy rather than getting bogged down in software. Treating thumbnail optimization as an ongoing practice is what drives long-term success.
FAQs
How can I estimate a competitor’s CTR without impressions data?
You can get a sense of a competitor's click-through rate (CTR) by studying their top-performing videos and thumbnails. Pay attention to videos with unusually high view counts and analyze the elements in their thumbnails - things like color schemes, text overlays, and imagery. Try to spot patterns or styles that seem to grab attention and drive engagement. Tools like ThumbnailCreator can be useful for spotting design trends, offering clues about what encourages viewers to click, even if you don’t have access to direct impressions data.
What’s the best way to tell if a thumbnail or the topic drove the views?
To figure out whether a thumbnail or the topic attracted views, dig into YouTube Analytics, focusing on metrics like Click-Through Rate (CTR) and audience engagement. Experiment with A/B testing by using different thumbnails to compare performance. YouTube offers built-in tools for testing, which can help pinpoint the effect of thumbnails. Additionally, track traffic sources and match them with CTR data to understand whether it was the thumbnail or the topic that had a bigger impact.
How long should I run a thumbnail test before judging results?
To get reliable insights into click-through rates (CTR) and viewer engagement, run a thumbnail test for at least 7 to 14 days. During this period, aim for 1,000 to 5,000 impressions per variation. This approach provides enough data to determine which thumbnail resonates better with your audience, helping you make informed, data-backed decisions.