

How to Benchmark Thumbnail Performance vs Competitors
I use competitor thumbnails to find test ideas - not to prove what works. Start with 5–10 similar channels, compare videos at the same age, and flag those with at least 2× their channel’s usual views. That’s a screening rule, not proof that the thumbnail drove the views.
Here’s my process:
- Set a baseline: Group similar videos by topic, format, and audience.
- Compare designs: Check faces, subject size, text, contrast, layout, and mobile readability in outliers and ordinary performers.
- Test one change: Build a control and up to two alternatives in ThumbnailCreator, keeping the title unchanged.
- Check results: Use YouTube’s watch-time-based test outcome alongside your own CTR and retention data. Repeat promising patterns before making them a rule.
The limit: <u>public views don’t reveal competitor CTR</u>. I treat competitor patterns as hypotheses and use my own tests to decide what to keep.
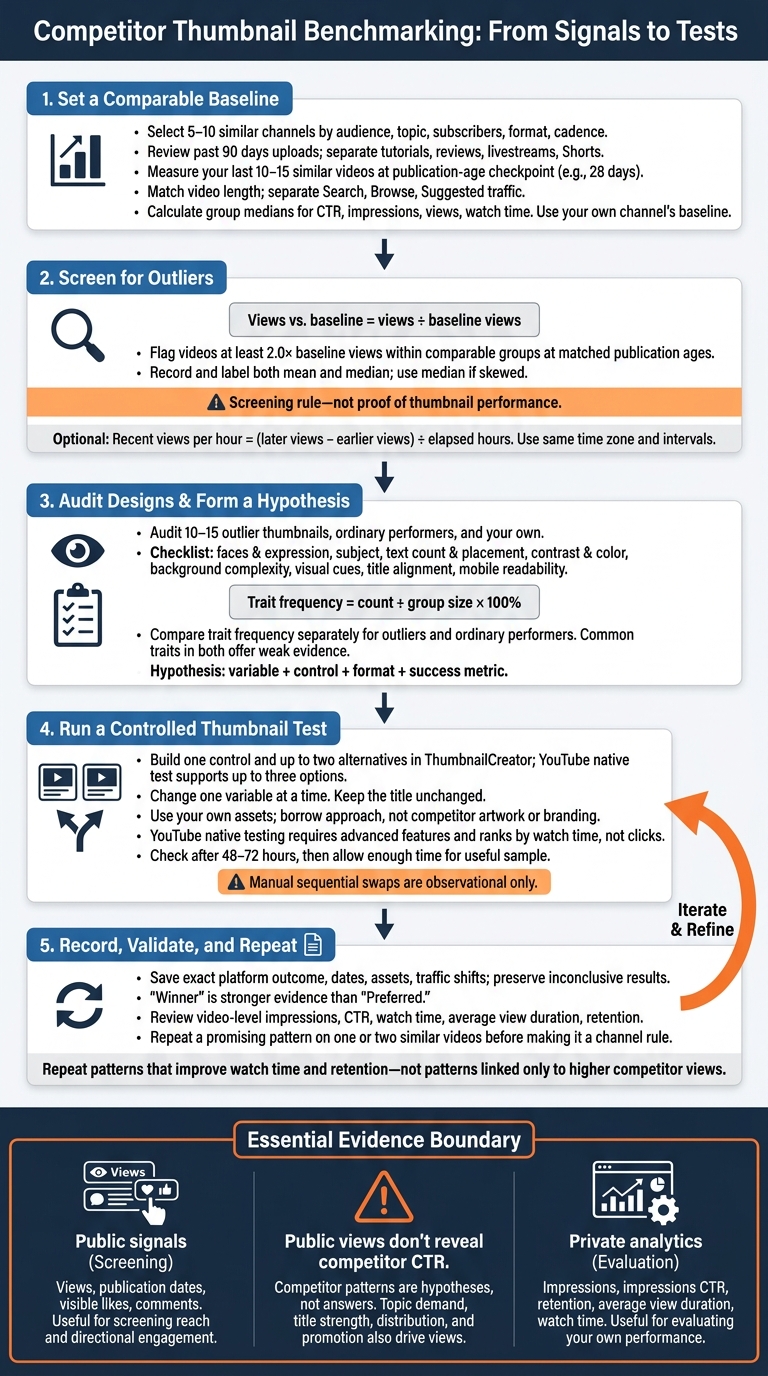
Competitor Thumbnail Benchmarking: From Signals to Tests
Step 1: Choose Competitors and Set Your Baseline
Choose 5–10 Similar Channels
Use the patterns from the last section to choose channels that make sense to compare. Match them by audience, topic, subscriber range, video format, and publishing cadence - not just size. Review uploads from the past 90 days, keeping tutorials, reviews, livestreams, and Shorts thumbnails in separate groups.
Measure Your Last 10–15 Similar Videos
In YouTube Analytics, collect data for 10–15 comparable videos at the same checkpoint, such as 28 days after publication. Match video length and separate Search, Browse, and Suggested traffic.
Record unique viewers and audience retention alongside the fields below. Save publication dates and collection timestamps with an explicit time zone, such as October 7, 2026, 2:00 PM ET. When researching competitors, label likely traffic sources as assumptions - not measured facts.
Illustrative baseline rows - not measured results: Keep one row per video and use consistent units.
| Video | Publication age | Format | Primary traffic source | Impressions | CTR | Views | Average view duration | Watch time |
|---|---|---|---|---|---|---|---|---|
| Tutorial 1 | 28 days | Long-form tutorial | YouTube Search | 48,200 | 6.8% | 5,100 | 5:42 | 484 hours |
| Tutorial 2 | 28 days | Long-form tutorial | Browse features | 72,600 | 5.4% | 6,900 | 6:10 | 710 hours |
| Tutorial 3 | 28 days | Long-form tutorial | Suggested videos | 35,900 | 8.1% | 4,200 | 4:58 | 348 hours |
Calculate median CTR, impressions, views, and watch time for each comparable group. Medians keep one unusually successful upload from skewing your baseline. Use your channel’s numbers rather than a universal CTR target. Check viewing quality against YouTube’s typical-retention comparison, which uses your 10 latest videos of similar length.
Distinguish Private Metrics From Public Signals
Use private analytics for impressions, CTR, retention, average view duration (AVD), and watch time. Public signals include views, dates, likes, and comments. Treat public views as a sign of reach - not a thumbnail score.
| Metric or signal | Access | Appropriate use |
|---|---|---|
| Impressions | Private: YouTube Analytics | Measure registered thumbnail exposure |
| Impressions CTR | Private: YouTube Analytics | Evaluate title-and-thumbnail response |
| Audience retention | Private: YouTube Analytics | Check where viewers stay or leave |
| Average view duration | Private: YouTube Analytics | Compare viewing depth across similar-length videos |
| Watch time | Private: YouTube Analytics | Measure total viewing generated |
| Views | Public and private | Compare reach at similar publication ages |
| Publication date | Public | Match ages and track upload cadence |
| Visible likes and comments | Public | Assess directional engagement, not viewing quality |
Use this baseline in the next step to spot outlier thumbnails.
sbb-itb-b59debf
Step 2: Find Outliers and Audit Thumbnail Designs
Flag Videos at 2.0× or More Than Baseline Views
Use the same comparable group from Step 1. Flag videos with at least 2.0× the group’s baseline views, calculated as views ÷ baseline views. Record and label both the mean and median. Use the median if one video has an unusually high view count, and identify the uploads used for the baseline. This threshold is a screening rule - not a YouTube standard.
Use the spreadsheet below for flagged videos, ordinary performers, and your own comparable uploads. Keep one row per video, and add columns for channel, URL or internal identifier, observation timestamp, and topic. Record likes, comments, and shares when available, but treat them as context rather than a stand-in for performance.
The rows below describe what to record, not measured results.
| Video title | Publication date | Age at observation | Format | Views | Baseline views | Views vs. baseline | Visible engagement | Thumbnail reference |
|---|---|---|---|---|---|---|---|---|
| Flagged video: exact title | Upload date | Days since upload | Specific format | Observed count | Mean or median baseline | Views ÷ stated baseline | Likes, comments, shares when available | Saved image, screenshot, or stable file name; collection date |
| Ordinary performer: exact title | Upload date | Matched age window | Same format | Observed count | Channel baseline | Views ÷ stated baseline | Likes, comments, shares when available | Saved image, screenshot, or stable file name; collection date |
| Your video: exact title | Upload date | Matched age window | Same format | Observed count | Your channel’s baseline | Views ÷ stated baseline | Likes, comments, shares when available | Saved image, screenshot, or stable file name; collection date |
Public views signal reach. Impressions and impressions CTR remain private analytics.
Calculate recent views per hour: (later views − earlier views) ÷ elapsed hours. Record both timestamps in the same time zone, and compare similar observation intervals. Note external promotion, topic spikes, and title changes that may affect the numbers.
Then compare the flagged videos’ thumbnails with those of ordinary performers.
Review 10–15 Outlier Thumbnails With One Checklist
Score each thumbnail using the same checklist. The goal is to see whether outliers share design traits that ordinary videos don’t.
Audit 10–15 outliers, a few ordinary videos near the median, and your own comparable uploads. If you have fewer relevant videos, use those and report the sample size. Don’t add unrelated videos just to reach the target.
Save each thumbnail as it appeared when collected, along with its collection date and video URL or internal identifier. Record the title, topic, publication age, and likely traffic context.
| Video and group | Faces | Expression | Main subject | Text count | Text placement | Contrast | Color strategy | Background complexity | Visual cue | Title alignment | Mobile readability | Collection date |
|---|---|---|---|---|---|---|---|---|---|---|---|---|
| Exact title / outlier | None, one, multiple | Neutral, surprise, fear, joy, anger, confusion, other | Person, product, object, scene, combination | 0, 1–3 words, 4–6 words, 7+ words | Left, right, top, bottom, centered, none | High, medium, low | Muted, natural, warm, cool, saturated, high-contrast | Simple, moderate, busy | Arrow, circle, reaction symbol, comparison, before/after, result, none | Matches, supports, repeats, conflicts | Clear, borderline, unclear | Image capture date |
| Exact title / ordinary | Same labels | Same labels | Same labels | Same labels | Same labels | Same labels | Same labels | Same labels | Same labels | Same labels | Same labels | Image capture date |
| Exact title / own | Same labels | Same labels | Same labels | Same labels | Same labels | Same labels | Same labels | Same labels | Same labels | Same labels | Same labels | Image capture date |
Count each trait separately for outliers and ordinary performers. Report count ÷ group size as a percentage. A trait that appears often in both groups offers weak evidence for putting it first in your testing plan.
Check subject and text clarity in a reduced mobile preview - not just at full size. Turn the strongest differences into hypotheses for A/B testing vs. gut feeling for controlled thumbnail tests in the next step. Each hypothesis should name the variable, control, format, and success metric. Keep the title unchanged during tests, and judge results by watch time and viewing quality as well as CTR.
Step 3: Create and Test Thumbnail Variations
Create Controlled Variations With ThumbnailCreator
Turn the strongest competitor patterns from Step 2 into thumbnail tests. Use ThumbnailCreator to build one control and up to two alternatives based on a single hypothesis drawn from those patterns.
Borrow the approach - not the artwork, logos, branding, or signature layout. Use your own assets and make the pattern fit your video’s promise. Change one variable at a time so you can tell what affected the result.
Run YouTube Thumbnail Tests and Check Watch Time and Retention
In YouTube Studio, open the thumbnail test and upload up to three options that reflect the outlier pattern you identified. You must have advanced features enabled. YouTube ranks results by watch time, not clicks alone, so keep the title unchanged. Treat “Winner” as stronger evidence than “Preferred.”
Check after 48–72 hours, then let the test run long enough to collect a useful sample. Alongside the test result, review video-level impressions, CTR, watch time, average view duration, and audience retention. Don’t treat these as variant-level data unless YouTube provides them that way.
If testing isn’t available, treat manual thumbnail swaps as observational only. Video age and traffic sources change over time, making it harder to link results to a thumbnail change.
Record Test Results and Choose What to Repeat
When the test ends, log the result exactly as YouTube reports it - even if it’s inconclusive. Save the asset files and exact result label. Note any edits made during the test, promotion, and traffic shifts.
Repeat a promising pattern on one or two similar videos before making it a channel rule. Small, limited, or mixed results call for another test.
| Record field | What to save |
|---|---|
| Hypothesis and thumbnail variants | The variable tested, expected effect, control file, and variation files; note what stayed unchanged |
| Test method, dates, and observation window | Native thumbnail-only test or sequential swap; actual start and end dates, elapsed time, and whether the test is still running |
| Reported outcome | Exact platform label and watch-time-based results when provided; log inconclusive results without forcing a winner |
| Video-level metrics | Impressions, CTR, watch time, average view duration, and retention for the same observation window; mark missing variant-level metrics as unavailable |
| Context and decision | Traffic-source changes, edits made during the test, promotion, uncertainty, and whether to repeat, retain the control, or stop testing the pattern |
How to Understand the Psychology Behind Competitor Outlier Thumbnails & Make Your Own Style Out It
Conclusion: Use Competitor Patterns to Plan Your Tests
Follow the loop: benchmark, spot outliers, test, repeat. Use thumbnail design patterns to inform your creative direction. Focus on 5–10 similar channels and use the same checklist from Steps 1–2. Keep public signals separate from private metrics.
Treat outliers as hypotheses, not answers. They give you ideas to test - not rules to follow. Higher competitor views alone can't tell you whether the thumbnail, topic demand, title strength, distribution, or promotion drove the results.
Turn those ideas into one controlled test. Use ThumbnailCreator to build one controlled variation, then assess it using your own YouTube analytics. Repeat only patterns that improve watch time and retention, not those linked to higher competitor view counts.
FAQs
How can I benchmark thumbnails in a small niche?
Find 3–5 competitors that rank for your main keywords and use similar video formats. Subscriber count doesn’t matter. Score 15–20 recent thumbnails for subject clarity, emotional impact, color contrast, and text readability. Then look for videos with views well above their channel’s average to spot visual patterns that work.
Use ThumbnailCreator to test those patterns on your channel for 7–14 days. Change only one variable at a time, such as facial expression or text placement, so you can tell which change affects results.
What if my thumbnail test raises CTR but lowers watch time?
A higher click-through rate (CTR) paired with a lower average view duration (AVD) can mean your thumbnail promises too much - or draws the wrong audience. Viewers click, then leave soon after. YouTube prioritizes total watch time, so more clicks alone don’t mean better results.
Keep your thumbnail and title aligned with what your video delivers. Use ThumbnailCreator to refine clear, honest visual hooks, and track CTR and AVD together.
When should I retest an inconclusive thumbnail result?
If a thumbnail test doesn’t give you a clear result, keep it running until you have enough data to draw a reliable conclusion. Aim for 1,000 to 5,000 impressions per variant.
A standard test lasts 7 to 14 days. If your channel gets fewer than 10,000 impressions per week, extend the test to one month. Hold off on judging results during the first 24 to 48 hours - the data can be noisy and misleading.