

How Industry Leaders Optimize Thumbnails for CTR
I judge a thumbnail by the clicks it earns - and whether viewers keep watching. My approach: study leading channels, test one visual change at a time, and use watch-time share, not CTR alone, to compare results.
Here’s the workflow I use:
- Set a baseline: Track 7–14 days of performance, comparing similar videos within Browse, Suggested, or Search.
- Study the patterns: Review 20 relevant thumbnails per leading channel. Public views suggest ideas; they don’t prove thumbnail performance.
- Build controlled variants: Use one focal point, readable mobile layouts, and text only when needed. I use ThumbnailCreator to draft 2–3 versions, then check each against the video’s actual promise.
- Test and learn: Run YouTube’s Test & Compare, review watch-time share, and check video retention. I log the results and revisit my design rules every 3–6 months.
The goal is simple: <u>earn the click without misleading the viewer</u>. A higher CTR isn’t a win if people leave because the video doesn’t deliver.
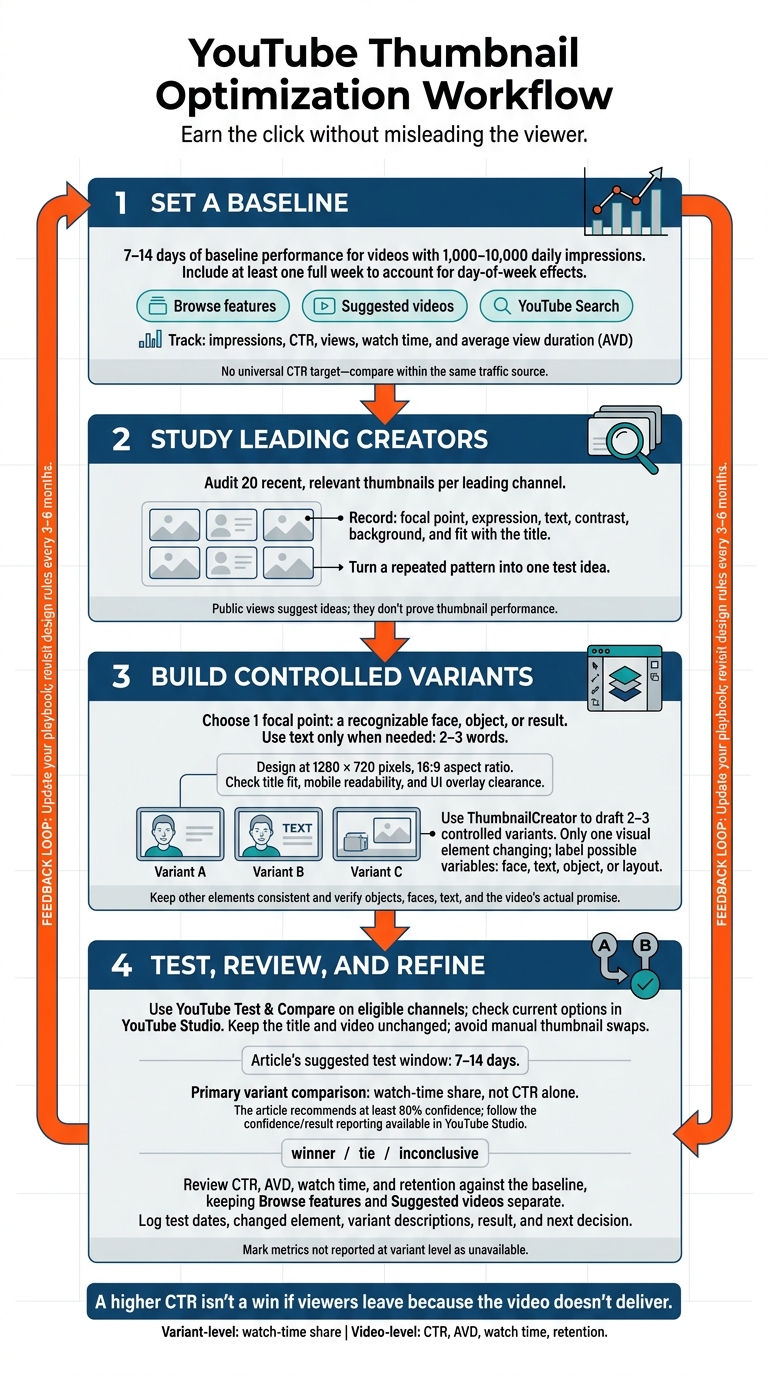
YouTube Thumbnail Optimization Workflow
Step 1: Set a Baseline and Study Leading Creators
Compare Similar Videos by Traffic Source
In YouTube Analytics, compare videos that share the same topic, format, audience, and traffic source. Track impressions, CTR, views, watch time, and average view duration (AVD).
For videos with 1,000–10,000 daily impressions, use a 7–14 day baseline, including at least one full week to account for day-of-week effects. Start with higher-traffic videos. Once you’ve set the baseline, keep comparisons within the same traffic source.
Separate Browse features, Suggested videos, and YouTube Search. Home and Subscriptions fall under Browse features. Viewers arrive at these placements with different intentions, so there’s no universal CTR target. Measure changes against similar videos from the same traffic source using CTR, AVD, and watch time.
Your baseline shows how your thumbnails perform. The audit helps you spot what top channels may do better.
Audit 20 Recent Thumbnails per Leading Channel
Choose channels that serve your target audience and content category. Review each channel’s latest 20 relevant thumbnails, recording the focal point, expression, text, contrast, background, and fit with the title. Look for design patterns that may improve clicks without changing the video’s core promise.
Use those repeated choices to build one test idea, rather than redesigning everything.
| Signal | Where to find it | Meaning | Limit on interpretation |
|---|---|---|---|
| Impressions and CTR | Your YouTube Analytics | Thumbnail exposure and click rate | CTR alone doesn’t show viewing quality |
| Watch time and AVD | Your YouTube Analytics | Time spent watching | Topic and content also affect results |
| Watch time share | Your Test & Compare results | Each variant’s share of test watch time | Not available from public video pages |
| Views | Public video page | Total viewing activity | Search and external embeds can contribute |
| Likes and comments | Public video page | Audience engagement | Don’t reveal thumbnail impressions or CTR |
| Upload timing | Public video page | Recency and context | Videos of different ages have unequal time to accumulate views |
Turn Design Patterns Into Test Ideas
Public signals can suggest a test, but they don’t prove a pattern works. Take a repeated design choice and test it by changing a single visual element.
Use that test idea to create your next thumbnail variant.
sbb-itb-b59debf
YouTube Thumbnail CTR Strategy
Step 2: Design Clear Thumbnail Variants
Turn the strongest pattern from Step 1 into one clear thumbnail concept.
Choose 1 Focal Point
Choose one recognizable face, object, or result that represents the video’s main idea. Use a contrasting background, make the subject larger, and remove clutter so viewers know where to look. Keep the layout simple without overstating what the video delivers.
If text adds needed context, limit it to 2–3 words. Otherwise, skip it. Facial expressions should match what actually happens in the video.
Check Title Fit and Mobile Readability
Let the title explain the topic and the thumbnail show the main subject or result. Preview them together at mobile size. Check that viewers can recognize the subject, read the text, and see key details without UI overlays covering them. Use 1280 × 720 pixels at a 16:9 aspect ratio.
Once the layout is clear on mobile, use the same structure to build controlled variants.
Create Controlled Variants With ThumbnailCreator
Use ThumbnailCreator’s AI generation and templates to draft one base layout, then make 2–3 controlled variants for testing.
Try text editing, face swapping, or object swapping. Keep the background, text placement, and other elements consistent so you can tell which change affected performance.
Review each version before uploading. Check objects, faces, and text for accuracy. ThumbnailCreator helps you make variants; testing and watch time share determine which one wins.
Step 3: Test Thumbnails and Check Watch Time
Once you have two or three controlled variants, you're ready to test.
Run a Controlled Thumbnail Test
Use YouTube’s native Test & Compare on eligible channels. Check YouTube Studio for current eligibility and testing options.
Keep the title and video unchanged, and don’t swap thumbnails manually. Manual swaps mix design changes with shifts in timing and audience, making the results harder to interpret.
Run the test for 7–14 days, then choose the winner by watch-time share, requiring at least 80% confidence. If the result is inconclusive, log it and test a clearer difference next time.
Let the result guide which traffic source and visual pattern you test next.
Review Traffic Sources and Viewer Retention
Review Browse features and Suggested videos separately. Compare CTR with watch-time share, average view duration, and retention. CTR can drop as a video reaches a broader audience, so judge the result against your Step 1 baseline, not channel-wide averages.
Keep video-level analytics separate from variant-level results. If overall CTR increases but viewing time gets shorter, check whether the thumbnail could be misleading. Use watch-time share to compare variants and video retention to see whether the opening delivers on the thumbnail’s promise.
Record what those signals show, then use them to plan the next variant.
Log Results and Choose the Next Test
Record the test dates and what you changed: face, text, object, or layout. Log whether the test produced a winner, a tie, or an inconclusive result. Base your next test on the change with the strongest support.
| Test variable | Variant description | Impressions | CTR | Watch-time share | Average view duration | Result | Next decision |
|---|---|---|---|---|---|---|---|
| Face | Calm vs. surprised | - | - | Native test output | - | Winner / tie / inconclusive | Retain if supported |
| Text | Text vs. no text | - | - | Native test output | - | Winner / tie / inconclusive | Adopt if supported |
Use unavailable for metrics YouTube does not report at the variant level.
Conclusion: Repeat the Workflow
Study leading creators, test controlled variants, and keep the winners. Build a channel playbook from your benchmarks, audits, and tests. Judge CTR alongside watch-time share, not on its own.
Use the playbook before every upload. Re-test your core assumptions every 3–6 months, and treat winning approaches as temporary rules.
Use this quick check to protect CTR and watch-time share.
Before each upload:
- Test setup: Use YouTube’s Test & Compare to test up to three variants.
- Mobile: Keep the design simple, high-contrast, and readable at small sizes.
- Title: Make sure the title and thumbnail complement each other.
- Accuracy: Match every visual claim to the video.
- Traffic source: Match the design to Browse, Suggested, or Search.
- Logging: Record the date, variants, impressions, CTR, watch-time impact, and result.
Repeat the loop: benchmark, test, review, refine.
FAQs
How can I test thumbnails with low traffic?
Low-traffic videos take longer to collect enough data you can rely on, so prioritize higher-traffic content. When testing a low-traffic video, aim for at least 1,000 impressions per variant and let the test run for 14–28 days to account for weekly fluctuations.
Use YouTube’s Test & Compare to test variants at the same time. This avoids the bias that can come from testing them one after another. Change only one variable per test, and assess CTR alongside watch time and average view duration so misleading thumbnails don’t win on clicks alone.
Why might higher CTR mean less watch time?
A higher click-through rate (CTR) doesn’t always mean more watch time. If the thumbnail promises something the video doesn’t fully deliver, viewers may click but leave soon after [2][3]. Those who aren’t interested in the actual content may also leave early, lowering average view duration [4]. YouTube’s algorithm puts a lot of weight on watch time, so short views can signal viewer dissatisfaction and lead to fewer impressions over time.
When should I retest a winning thumbnail?
Retest when your core assumptions about your audience or the platform’s algorithm change - typically every 3 to 6 months. Review thumbnails for your top 10 highest-traffic videos from time to time, and consider redesigning them as viewer preferences shift.
If earlier tests were inconclusive or showed only a small lead, retest with a bigger change to the variable you’re testing to get clearer data. Always use your current winning thumbnail as the baseline.