

A/B Testing Thumbnails: Lessons from Audience Data
The short answer: the best thumbnail is not the one with the highest CTR. It’s the one that drives more watch time from the right viewers.
If I were boiling this down for a U.S. creator in 2026, I’d say this:
- YouTube picks winners by watch-time share, not clicks alone
- A high CTR can still be a bad result if viewers leave fast
- One-variable tests give cleaner answers than full redesigns
- 2 to 4 weeks is often a better test window than 24 hours
- Small lifts - like under 15% to 20% - often aren’t strong enough to trust
- Segment data matters: mobile, desktop, new viewers, returning viewers, Browse, and Search can all react in different ways
That means thumbnail testing is less about finding a “best style” and more about learning what gets your audience to click and keep watching.
If I’m using audience data the right way, I’m not trying to prove that red beats blue or faces beat no faces. I’m trying to answer a simpler question: did this thumbnail bring in more viewing time under the same conditions?
What I’d keep from this article is simple: test one clear change, let the test run long enough, read CTR with retention and watch time, and log each result so the next test starts from data instead of guesswork.
How to A/B Test YouTube Thumbnails (Step-by-Step)
sbb-itb-b59debf
What Thumbnail A/B Tests Actually Measure
Thumbnail tests track reach, clicks, and what happens after the click at the same time. And that matters, because each metric answers a different question. If you look at just one, it's easy to call the wrong winner.
| Metric | What It Means | What It Reveals | Limitation When Used Alone |
|---|---|---|---|
| Impressions | How many times the thumbnail was shown | Reach | Doesn't indicate if the visual was appealing or relevant |
| Click-Through Rate (CTR) | Percentage of impressions that turned into clicks | Click appeal | Can rise even when viewers leave quickly |
| Average View Duration (AVD) / Retention | How long viewers stayed after clicking | Whether the thumbnail matched the video | Doesn't show how many people were reached in the first place |
| Watch-Time Share | Total viewing time a variant generated relative to others | Total viewing value | Requires a large sample size and longer duration to be reliable |
The smart way to read a thumbnail test is to read these metrics together. One shows exposure. Another shows click appeal. Another shows whether the thumbnail set the right expectation.
Impressions, CTR, and Watch-Time Share
YouTube's Test & Compare ranks thumbnails by watch-time share. So the winner isn't just the thumbnail that gets the most clicks. It's the one that leads to the most total viewing time.
That's a big difference.
A thumbnail can pull in clicks and still lose if those viewers don't stick around. On the flip side, a version with a slightly lower CTR can still win if it brings in people who watch longer.
Why a High CTR Can Still Be a Weak Result
A high CTR with weak retention usually means the thumbnail overpromised. The click happened, but the video didn't deliver on what the image seemed to promise.
That's why a smaller CTR gain with steady retention - or better retention - is often the stronger result. It means the thumbnail didn't just attract attention. It brought in the right viewers.
When you read audience data this way, weaker results start to make more sense. And once you can do that, test setup starts to matter just as much as the result itself.
How to Design a Reliable Thumbnail Experiment
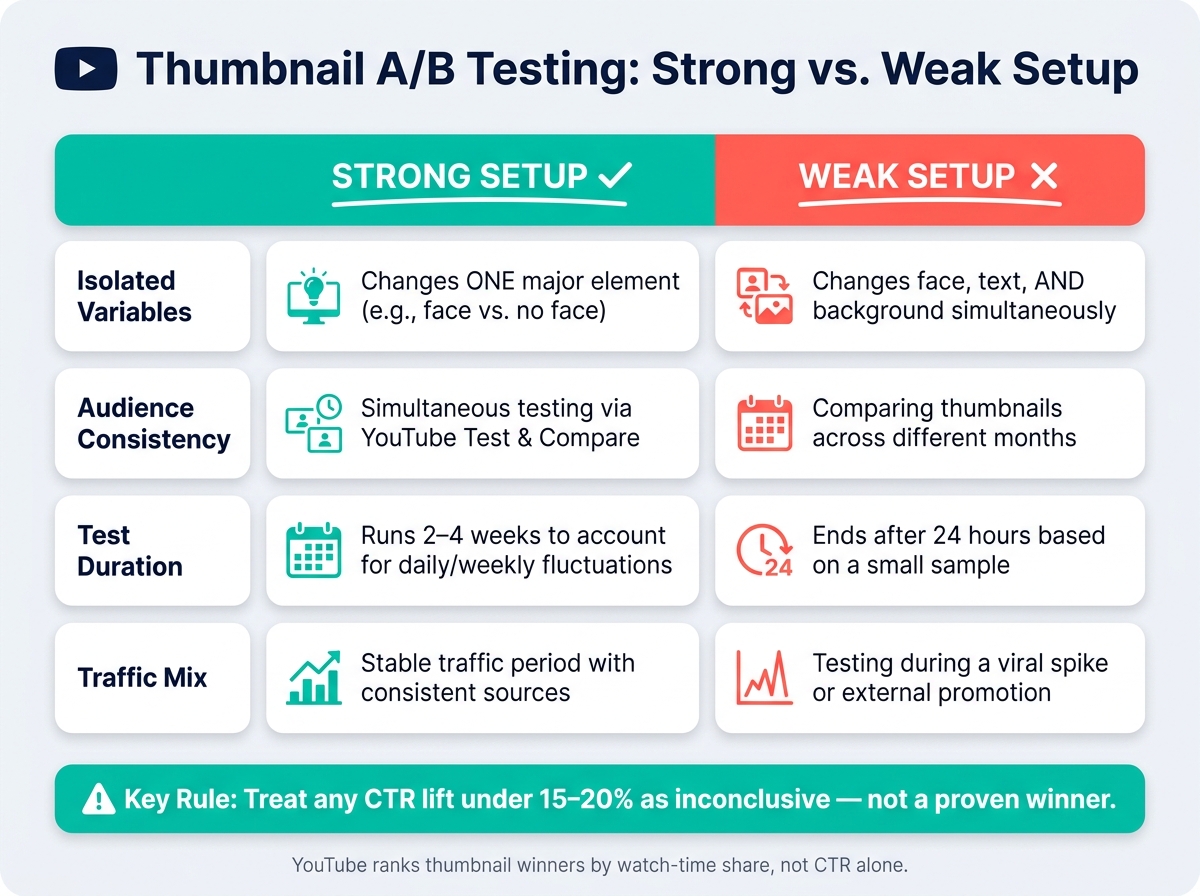
Thumbnail A/B Testing: Strong vs. Weak Setup Cheat Sheet
A clean test gives you something you can act on. A messy test just gives you noise.
So the next step isn't only reading the result. It's controlling the test.
Test One Visual Variable at a Time
Change one major visual element at a time. For example:
- face vs. no face
- brighter vs. darker color
- text vs. no text
If you change the face, the text, and the background all at once, you won't know what caused the shift. That's the trap. The thumbnail may win, but you still won't know why.
Keep the Video, Title, and Distribution Conditions Consistent
Thumbnail tests don't happen in a vacuum. Title, publish timing, and traffic mix can all shape the outcome.
That's why simultaneous testing matters. YouTube's Test & Compare tool splits current traffic between thumbnail variants under the same conditions. That setup gives you a cleaner read. By contrast, comparing a new thumbnail to one used in a different month brings in too many unknowns to trust the result.
The point is simple: isolate the thumbnail from everything else that can skew the numbers.
| Factor | Strong Setup | Weak Setup |
|---|---|---|
| Isolated Variables | Changes one major element (e.g., face vs. no face) | Changes face, text, and background simultaneously |
| Audience Consistency | Simultaneous testing via YouTube's Test & Compare | Comparing thumbnails across different months |
| Timing | Runs 2–4 weeks to account for daily/weekly fluctuations | Ends after 24 hours based on a small sample |
| Traffic Mix | Stable traffic period with consistent sources | Testing during a viral spike or external promotion |
When the Data Is Inconclusive
Not every test gives you a clean winner. That's normal.
A weak result or split result can still tell you something useful: the change may have been too subtle. If YouTube reports no winner, or the gap is small, treat that result as a starting point. Use it to plan a stronger next test - one that changes a higher-impact variable and gives the data enough space to show a clear difference.
What Audience Data Reveals About Thumbnail Preferences
Audience data can tell you which thumbnail won for this video and this audience. That’s the key point. The win matters, but the bigger payoff is the pattern behind it, not some one-size-fits-all rule.
Reading CTR, Retention, and Watch Time Together
CTR tells you whether the thumbnail got the click. Retention tells you whether the video delivered on that promise. Watch time shows how much viewing time you got in total. Put those three together, and you can usually tell whether the problem is appeal, expectation, or the kind of audience coming in.
A sharp early drop in the retention curve often means viewers expected a different topic, result, person, or level of urgency than the video delivered. That’s why it helps to compare what the thumbnail seems to promise with what the first 30–60 seconds of the video actually gives people.
Once you know the overall winner, don’t stop there. Look at who drove that result: new or returning viewers, mobile or desktop users, and Browse or Search traffic.
| Pattern | What It Suggests | What to Do Next |
|---|---|---|
| CTR differs by traffic source | The gap may reflect audience intent or placement | Compare like with like instead of relying on one blended CTR |
| CTR lower on mobile than desktop | Small text or small elements may not read well on a phone screen | Simplify the composition and see whether mobile CTR improves; then confirm retention still holds up |
| CTR differs between new and returning viewers | New viewers may need clearer subject cues, while returning viewers may recognize a format or series signal | Test a concept that is easier to read at a glance for new-viewer traffic |
Comparing New and Returning Viewers, Devices, and Traffic Sources
New viewers often respond better to imagery that makes sense right away. This is especially true for tutorial video thumbnails where the value proposition must be immediate. Returning viewers may already know the creator, a recurring format, or a series cue. Still, these are only testable ideas, not YouTube thumbnail guides or design laws. Your own channel data has the final say.
It also helps to compare devices when the sample is big enough. If mobile viewers show lower CTR than desktop viewers, and the thumbnail uses small text or several tiny elements, test a simpler layout. Then check whether mobile results improve. But there’s a catch: a simpler thumbnail may get more clicks while saying less about the video, so CTR alone isn’t enough. Check retention too.
Traffic source changes the meaning of the data. Browse tends to reward broad appeal. Search leans more on query match. Suggested depends more on relevance to nearby content. External traffic can act differently from all of them. When you can, track impressions, CTR, views, average view duration, retention, and watch time for each major source on its own. Save those segment results before changing the thumbnail again.
Turning Test Results Into Better Thumbnail Decisions
Once you know how to read the data, the next step is simple: log it in a way that makes the next test easier to plan.
Record the Hypothesis, the Change, and the Outcome
Document each test before it goes live. Write the hypothesis in plain English - something like "A brighter background will stand out more in dark mode" - and note the exact visual element you changed. After the test ends, record CTR, watch-time share, retention, and audience segment. Keep each test in one sheet with the thumbnail, date, and result.
It also helps to separate data from interpretation. If a thumbnail wins on watch-time share, that’s evidence. If you think it won because a color choice felt more urgent, that’s just an idea for the next test - not a rule you’ve proven yet. Mark those two things differently in your log.
Treat lifts under 15–20% as inconclusive.
Build a Channel-Specific Playbook From Repeated Tests
Repeated tests show what keeps working on your channel. More to the point, they show which variables actually move CTR for your audience.
Use each winning thumbnail as the new baseline for the next test. That’s how a playbook takes shape: not from broad best practices, but from your own repeated results.
Use these patterns to pick the next experiment:
| Observed Result | Likely Interpretation | Next Test |
|---|---|---|
| High CTR / Low Watch Time | Thumbnail overpromises; align it with the video payoff. | Test a version that more accurately reflects the video's payoff |
| Low CTR / High Watch Time | Good video, weak packaging; test a stronger visual hook. | Test high-impact visual changes like background color or a more emotive facial expression |
| Winner leads by <3% | Difference is too small to act on. | Test a radically different composition or color scheme |
| High CTR / High Watch Time | Use as the new baseline; test one new variable. | Use it as the new baseline; test a different secondary variable such as text vs. no text |
To move faster, generate variants from the same base design. Use ThumbnailCreator to create controlled variants faster by swapping backgrounds, faces, or text while keeping the rest fixed.
Conclusion: Use Thumbnail Testing to Improve Decisions, Not to Prove Universal Rules
Use test results to make the next decision better. CTR alone doesn’t tell the whole story - watch-time share and retention help confirm whether a thumbnail pulled in the right viewer. Controlled experiments, documented results, and steady iteration are what turn one-off wins into lasting gains.
The channels that keep getting better aren’t the ones chasing universal rules. They’re the ones running the next test, logging the result, and using what they actually learned.
FAQs
How much data is enough to trust a thumbnail test?
You need enough data to get past random noise. At a bare minimum, aim for 1,000 impressions per variant. If you can get to 2,000 to 5,000 impressions, your read on the result gets a lot more reliable. And if you're trying to hit 95% statistical significance, you may need as many as 10,000 impressions.
Time matters too. Let the test run for 7 to 14 days so it can pick up normal weekly traffic swings instead of giving you a skewed result from a short burst of activity.
One more thing: watch time per impression matters more than click-through rate. A high CTR can look good at first glance, but if people click and leave fast, that result doesn't help much.
What should I do if CTR goes up but watch time drops?
Your thumbnail may be creating a mismatch. In plain English, it’s promising one thing while the video delivers another. When that happens, people click, realize it’s not what they expected, and leave early. That early drop-off can hurt long-term reach and recommendations.
Adjust the thumbnail so it matches the video more closely. But don’t judge the change by clicks alone. It only counts as a win if retention stays flat or gets better.
If average watch time drops by more than 5%, treat the new thumbnail as a failure. Same goes if more than 40% of viewers leave in the first 30 seconds.
Should I test different thumbnails for mobile and desktop viewers?
Yes. Thumbnail performance can change by device type because mobile viewers see images at a much smaller size. So a thumbnail that looks good on desktop might fall flat on a phone.
Check click-through rate by device type in YouTube Analytics. If mobile CTR starts to slip, ThumbnailCreator can help you make phone-friendly versions fast, with:
- Larger subjects
- Shorter text
- Higher contrast