
Thumbnail A/B Testing: Why Results Mislead
Testing YouTube thumbnails might seem like a straightforward way to boost clicks, but many creators get misled by the results. Misinterpreting data, using the wrong metrics, and testing with insufficient impressions are common pitfalls. For example, YouTube prioritizes watch time over click-through rate (CTR), so a high-CTR thumbnail that reduces retention can hurt your channel's performance. Small channels face another issue: without enough impressions (1,000+ per variant), results often reflect random noise rather than meaningful patterns.
Key takeaways for better testing:
- Focus on bold, contrasting designs instead of small tweaks.
- Test one variable at a time (e.g., thumbnail vs. title).
- Use videos with high impressions (5,000+ for reliable results).
- Track both CTR and watch time to balance clicks and engagement.
My Youtube Thumbnail Tester is FLAWED ... here's Proof
sbb-itb-b59debf
Why Thumbnail A/B Tests Give Misleading Results
YouTube Thumbnail A/B Testing: Sample Size Requirements and Confidence Levels
Many creators believe thumbnail A/B testing leads to solid, data-driven decisions. But the reality is more complicated - several factors can distort the data, leading to results that might not be as reliable as they seem.
YouTube Prioritizes Watch Time Over CTR
YouTube doesn’t judge thumbnails based solely on how many clicks they generate. Instead, it focuses on something called "Watch Time Share", which measures how long viewers stay engaged after clicking. This means a thumbnail with a high click-through rate (CTR) can be rated as equal to one with fewer clicks if both achieve similar retention.
Take Dr. William Sen’s experience as an example. On his channel "LebenUSA", he tested two thumbnails for a 10-minute video about making Krispy Kreme donuts. Thumbnail A had a 22% CTR, while Thumbnail B only managed 4%. Despite this massive difference in clicks, both thumbnails resulted in an average watch time of 7 minutes. YouTube labeled them as equally effective (50/50) because retention was identical, even though Thumbnail A clearly attracted more viewers.
Marcus Chen, a YouTube optimization consultant, puts it this way:
YouTube's algorithm optimizes for watch time, not clicks... the recommendation system specifically looks for 'satisfaction signals' - did viewers watch substantial portions after clicking?
If a thumbnail increases CTR but lowers average watch time by more than 5%, it may actually harm the video’s performance in YouTube’s recommendations. Understanding this balance is essential when interpreting test results.
Small Channels Don't Get Enough Data
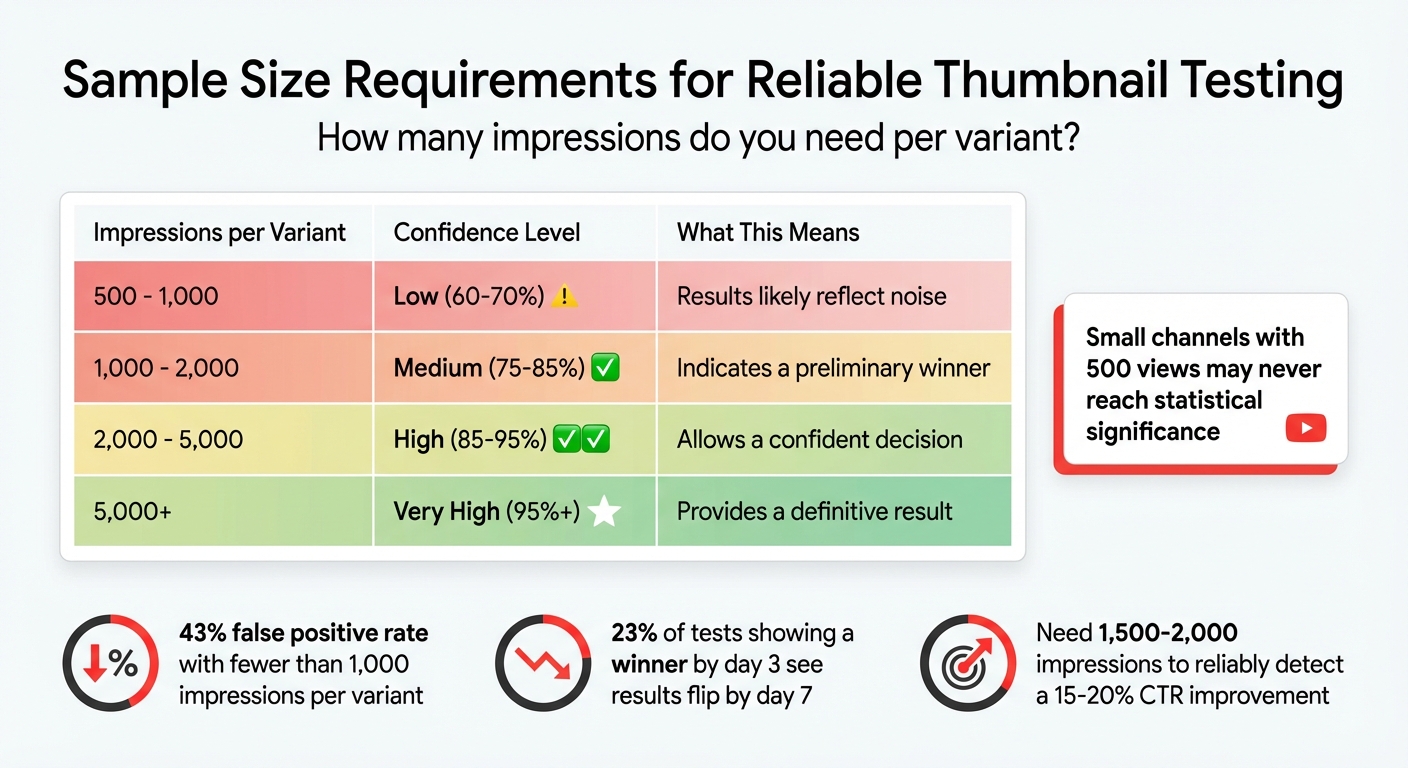
For smaller channels, insufficient data can make test results unreliable. When a thumbnail test gets fewer than 1,000 impressions per variant, the results often reflect random noise rather than meaningful differences. In fact, tests with fewer than 1,000 impressions per variant have a 43% false positive rate. That means nearly half the time, the so-called "winner" isn’t actually better - it just got lucky. Even more surprising, 23% of tests that show a winner by day 3 see the results flip entirely by day 7.
To reliably detect a 15–20% improvement in CTR, you need between 1,500 and 2,000 impressions per variant. A channel with 50,000 views can gather enough data in hours, but a channel with only 500 views might never reach statistical significance.
| Impressions per Variant | Confidence Level | Implication |
|---|---|---|
| 500 - 1,000 | Low (60-70%) | Results likely reflect noise |
| 1,000 - 2,000 | Medium (75-85%) | Indicates a preliminary winner |
| 2,000 - 5,000 | High (85-95%) | Allows a confident decision |
| 5,000+ | Very High (95%+) | Provides a definitive result |
Minor Changes Produce Unclear Results
Making small changes - like tweaking a font color - rarely leads to clear outcomes, especially for channels with limited reach. Subtle adjustments often fail to produce measurable differences. Instead, testing drastically different designs is more likely to show noticeable changes in watch time share.
Testing Thumbnails and Titles Together Confuses Results
Changing both your thumbnail and title at the same time complicates things further. When you adjust both simultaneously, you introduce confounding variables - it becomes impossible to pinpoint whether the thumbnail or the title caused the performance shift. This muddles your results and can lead to incorrect conclusions.
Marcus Chen emphasizes:
You can't know - the variables are confounded. Change one variable per test. Yes, this requires more tests to optimize completely, but it builds genuine understanding.
The solution? Patience and focus. Isolate your variables. If you’re testing text, keep the image unchanged. If you’re testing the background, leave the text alone. While this method takes longer, it’s the only way to truly understand what resonates with your audience.
How to Get Accurate Thumbnail A/B Test Results
If you want reliable results from your thumbnail A/B tests, you’ll need to approach testing with a clear strategy. Here’s how to do just that.
Test Completely Different Designs
Making small adjustments, like tweaking font sizes or slightly altering colors, won’t give you the clarity you need. Instead, go for bold, contrasting designs. For example, test a close-up of a human face against an object-based thumbnail, or compare bright, vibrant colors with a darker, moodier palette. You could also try contrasting a mysterious, minimalist design with one that’s action-packed.
Focus on the elements that grab attention: facial expressions, bold text hooks, or whether you include a human face at all. For instance, a Tech Tutorial channel saw its click-through rate (CTR) leap from 4.2% to 7.3% - a 74% increase - just by swapping a neutral facial expression for a surprised one.
A helpful approach is the "Safe, Bold, Wild Card" method. Create one "safe" thumbnail, one with bold contrasts, and a "wild card" that’s completely out of the box. And don’t forget about mobile viewers - since 70% of YouTube views come from phones, keep text short (3–4 words max) and make sure faces are large enough to stand out on small screens. Avoid placing critical details in the bottom right corner, as YouTube’s timestamp overlay will obscure them.
Run Tests on Videos with High Impressions
Testing on low-traffic videos often leads to unreliable data. Aim for at least 1,000–2,000 impressions per thumbnail to get a sense of performance, and 5,000 or more for a confident result. If your channel doesn’t yet generate that kind of traffic, use older, evergreen content that still gets steady views.
As Derral Eves noted at VidCon 2025:
"Most A/B failures happen because creators test on low-traffic videos, recommending 10k+ impressions minimum."
Take MrBeast’s team as an example. In Q1 2025, they tested thumbnails with over 50,000 impressions per upload. By comparing up to four variants per video at this scale, they increased their average CTR from 5% to 16.4%, gaining an extra 45 million views in just 30 days.
Track CTR Yourself
High impressions are critical, but tracking your click-through rate (CTR) independently is just as important.
While YouTube’s "Test & Compare" tool prioritizes metrics like watch time share, you’ll want to focus on CTR as well. Use the Reach tab in YouTube Studio Analytics to monitor the "Impressions click-through rate" for each thumbnail variant.
Swap thumbnails every 48–72 hours and log the results in a spreadsheet. Over time, you might notice patterns, like your audience responding better to certain colors or expressions. But don’t rush to conclusions. As BerryViral points out:
"A 0.3% CTR lead after three days and 200 impressions means nothing. Wait for the platform to tell you it's confident."
Run your tests for 10–14 days to account for differences in weekday versus weekend viewing habits. And always check watch time alongside CTR to ensure you’re not just attracting clicks, but also keeping viewers engaged.
Use ThumbnailCreator to Speed Up Testing
If you need to generate thumbnail variants quickly, ThumbnailCreator (https://thumbnailcreator.com) can be a game-changer - even if you’re not a designer.
Its AI tools allow you to create multiple designs in minutes. Want to test a thumbnail with a human face versus one without? The face-swapping feature can adjust expressions or replace subjects instantly. You can also experiment with different backgrounds, objects, or text layouts using its customization tools, or choose from pre-made templates designed for high CTR.
At about $0.10 per image, ThumbnailCreator makes it easy to scale up your testing efforts. The quicker you can create and test new designs, the faster you’ll find the thumbnails that truly connect with your audience. These methods address many of the common thumbnail mistakes that can derail A/B testing efforts.
Wrong vs. Right Ways to Test Thumbnails
Making the right choices when testing thumbnails can significantly impact your channel's growth. Below, you'll find a breakdown of common mistakes and smarter strategies for effective testing.
Comparison: Common Mistakes vs. Better Methods
| Flawed Approach | Corrected Approach |
|---|---|
| Testing minor color changes on a low-impression video | Testing drastically different designs on a high-impression video |
| Mixing thumbnail and title in one test | Separating thumbnail tests from title tests to isolate variables |
| Relying solely on YouTube's watch-time metrics | Manually tracking CTR to prioritize click-through performance |
The table highlights how small tweaks on videos with low traffic often lead to misleading results.
As YouTube optimization consultant Marcus Chen explains:
Poor-quality tests lead to false conclusions and hinder effective decision-making.
For example, relying on A/B testing vs gut feeling for minor design changes often picks up random noise rather than showing clear audience preferences. On the other hand, testing bold design differences - like a close-up face versus a product-only shot - can provide clearer insights.
In November 2025, Marcus Chen ran an A/B test for a tech review channel with 287,000 subscribers. The test compared two thumbnails: one featuring a "Face + Product" and another showing just the product. The "Face + Product" thumbnail achieved a 9.19% CTR compared to 7.32% for the "Product Only" version, across 28,891 impressions. This showed a 25.5% relative improvement, with a p-value under 0.0001.
Another critical aspect is separating variables. Changing too many elements at once makes it impossible to identify what actually worked. As the founder of BananaThumbnail puts it:
If you change too much at once... you won't know what actually made the difference. It's like trying to diagnose a weird engine noise by replacing the spark plugs, the alternator, and the starter all at once.
By isolating one variable - like facial expressions or a text hook - you can build a library of what resonates with your audience. This method aligns with earlier advice about balancing click-through rates (CTR) with retention metrics.
Finally, tracking CTR manually is essential. While watch time is important, thumbnails heavily influence initial impressions, accounting for about 62% of them. Knowing whether your design grabs attention ensures you're not overly dependent on YouTube's watch-time metrics alone. The goal is to balance a strong CTR with good viewer retention, rather than focusing on one metric at the expense of the other.
In short, clear and focused testing methods lead to actionable insights, helping you refine thumbnails for maximum impact.
Conclusion
Understanding why misleading results occur highlights the importance of prioritizing data-driven thumbnail testing. Effective A/B testing for thumbnails demands avoiding common mistakes. For example, testing small adjustments - like tweaking font colors on videos with low traffic - often leads to statistical noise rather than meaningful insights. Instead, focus on bold changes by experimenting with entirely different concepts, such as comparing "face versus no face" or "minimalist versus text-heavy" designs. This approach works best on videos with at least 1,000 to 10,000 impressions per variant.
Thumbnails play a huge role, influencing about 62% of initial impressions. However, clicks alone don’t tell the whole story. YouTube's algorithm values watch time, so a misleading thumbnail that grabs clicks but lowers retention can hurt performance by as much as 30%. To get the full picture, track both click-through rates (CTR) and average view duration to ensure your content resonates with the right audience.
The numbers don’t lie - well-optimized thumbnails can achieve an average CTR of 9%, compared to just 4% for untested ones, resulting in a 2.07x improvement. From August 2025 to January 2026, the NoteLM Team conducted 127 controlled A/B tests. When a clear winner was identified, significant CTR boosts were consistently observed.
Tools like ThumbnailCreator make this process easier by generating multiple optimized variations in seconds. With AI-powered features like face swapping, text editing, and object swapping, you can create bold, diverse designs and test them systematically. This shifts thumbnail creation from guesswork to a data-driven strategy that delivers measurable results.
FAQs
What matters more for YouTube, CTR or watch time?
Click-Through Rate (CTR) plays a crucial role in pulling in those initial views by showing that your content catches attention. However, watch time is the real measure of how engaged and satisfied your viewers are. While both metrics matter, YouTube’s algorithm tends to place more emphasis on watch time when evaluating a video’s performance.
How many impressions do I need per thumbnail variant?
To get reliable test results, make sure each thumbnail variant receives at least 100 impressions. This ensures you have enough data to accurately assess performance differences.
How do I A/B test thumbnails without skewing results?
When testing YouTube thumbnails, it's important to tweak just one major element at a time - whether it's the color, text, or image. This way, you can pinpoint exactly what influences performance. Allow your test to run for 7–14 days to collect enough data, although low-impression videos might need a longer period. Take advantage of YouTube's Test & Compare feature, and prioritize watch time as a key metric. Even if the click-through rate (CTR) dips slightly, higher viewer retention often indicates a more effective thumbnail.