
Checklist for Running Thumbnail A/B Tests
Want to boost your video performance? Start with better thumbnails. A/B testing vs gut feeling helps you find designs that not only increase clicks but also keep viewers engaged. Here's how:
- Why test thumbnails? The right thumbnail can improve CTR by 3–7% and drive thousands of extra views.
- Key metrics to track: Focus on CTR and watch time share - YouTube prioritizes designs that attract clicks and retain viewers.
- How to test effectively: Use YouTube’s "Test & Compare" tool or run manual tests, ensuring each variant gets at least 1,000 impressions.
- What works best? Test bold, distinct designs and change only one element at a time for clear insights.
Thumbnail testing isn’t just about clicks - it’s about creating visuals that align with your content and audience preferences. Let data guide your choices for better results.
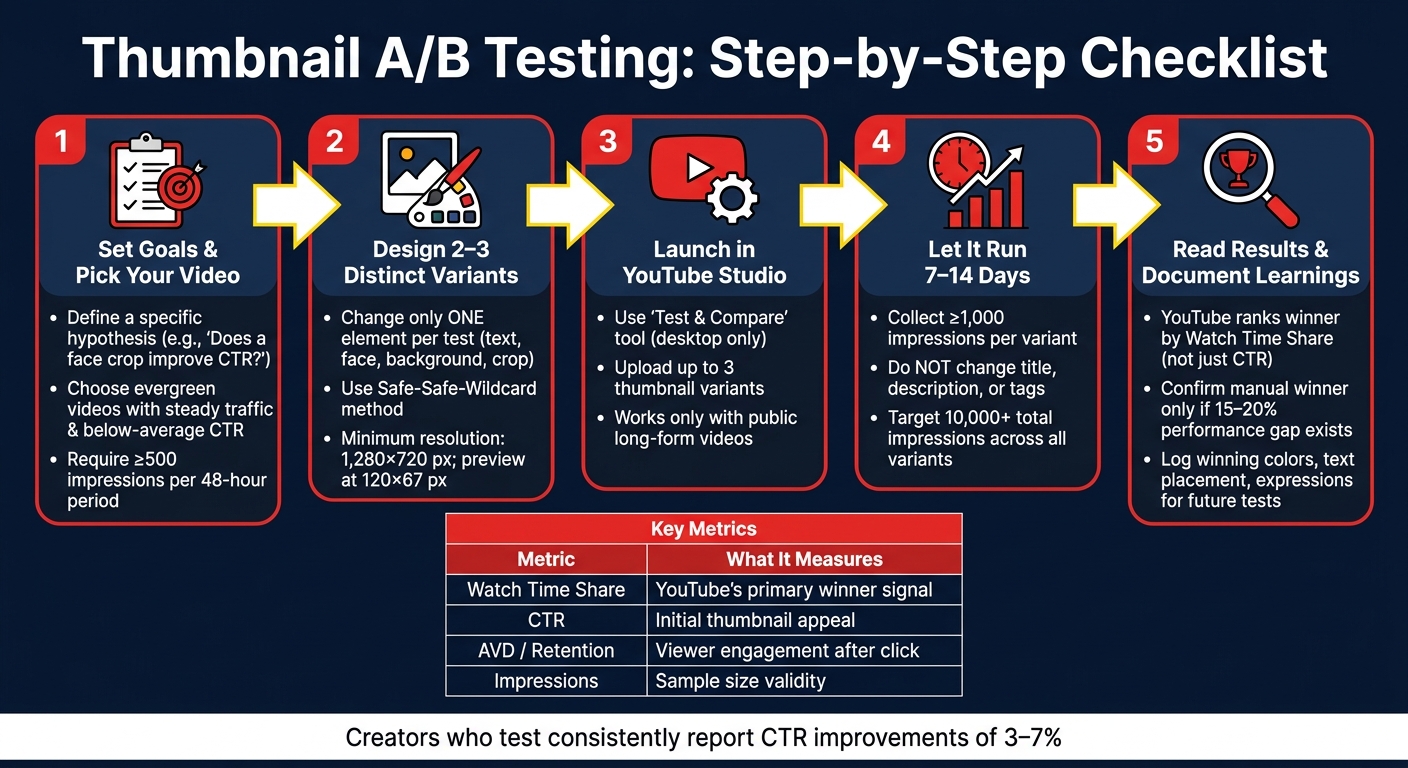
Thumbnail A/B Testing Checklist: Step-by-Step Process
How to A/B Test YouTube Thumbnails (Step-by-Step)
sbb-itb-b59debf
Planning Your Thumbnail A/B Test
Getting the most out of your thumbnail A/B tests starts with solid planning. You need to clearly define your goals, pick the right video, and set measurable benchmarks. This groundwork ensures your thumbnail variations are designed to deliver actionable insights through thumbnail comparisons.
Set Your Test Objective
Start by nailing down exactly what you want to learn. Be specific. For instance, you could ask: "Does a tighter face crop increase CTR without hurting average view duration?"
As of 2026, YouTube evaluates thumbnail performance using watch time share, which combines impressions, CTR (click-through rate), and average view duration. This means a thumbnail with a slightly lower CTR could still outperform if it keeps viewers engaged longer. Before you begin, decide how you'll measure success and track both CTR and watch time metrics in YouTube Studio. Once your objective is clear, you can move on to choosing the right video for your test.
Pick the Right Video to Test
Not all videos are suitable for testing. The best candidates are evergreen videos - those that consistently attract traffic over time. Look for videos YouTube is already showing to a large audience but that fall short of your channel’s average CTR. Specifically, focus on videos with steady traffic and below-average CTR. To ensure reliable results, choose videos with at least 500 impressions in a 48-hour period.
"Older evergreen videos are ideal test candidates. They have stable traffic patterns, which makes the test results more reliable than testing on a brand-new upload where traffic is volatile in the first 48 hours." - Rutvik Shirude, Co-Founder, GrowthOS
Aim to gather 1,000–5,000 impressions per thumbnail variant, with a total of at least 10,000 impressions across all variants. Also, double-check that your video qualifies for YouTube's "Test & Compare" tool. This tool doesn’t support Shorts, Premieres, kids' content, or age-restricted videos.
Write Your Thumbnail Hypotheses
A good hypothesis connects a specific visual change to a predicted viewer behavior. For instance: "Removing the text overlay improves first-read clarity without reducing average view duration."
To keep your test results clear, change only one element per test - like text, background, facial expression, or crop. This way, you’ll know exactly what influenced the outcome. Avoid testing minor tweaks; instead, experiment with distinct concepts. A helpful approach is the Safe-Safe-Wildcard method: create two variations that stick to your proven style and one that takes a bold, unconventional direction. This way, you protect your baseline performance while giving a riskier idea a chance to shine.
"Thumbnail testing is not an argument against creative instinct. Instinct helps you make strong candidates. Data helps you choose among them." - GrabThumbs Editorial Team
Creating and Preparing Thumbnail Variants
Once you've selected your video and formed a hypothesis, it's time to create thumbnail variants for upload. These tips will help you design thumbnails that are eye-catching and optimized for all screen sizes.
Design Your Thumbnail Variations
Instead of making small adjustments, aim for two to three completely different concepts. Think bold contrasts: a close-up of a face versus a product image, text-heavy versus minimal text designs, or a warm red background compared to a cool blue one. These dramatic differences are more likely to highlight a clear winner during testing. For a deeper dive into the methodology, see our thumbnail A/B testing guide.
Make sure every thumbnail is at least 1,280×720 pixels to avoid YouTube downscaling them to 480p. Lower resolution thumbnails can appear blurry, especially on mobile devices, where most viewers watch videos. Always export at 720p or higher for sharper results.
Also, preview your designs at 120×67 pixels to ensure the text is readable and faces remain distinct. If the design doesn't hold up, simplify it. Close-up expressions, bold contrasting text, and high-contrast lighting tend to stand out better at smaller sizes.
Speed Up Design with ThumbnailCreator
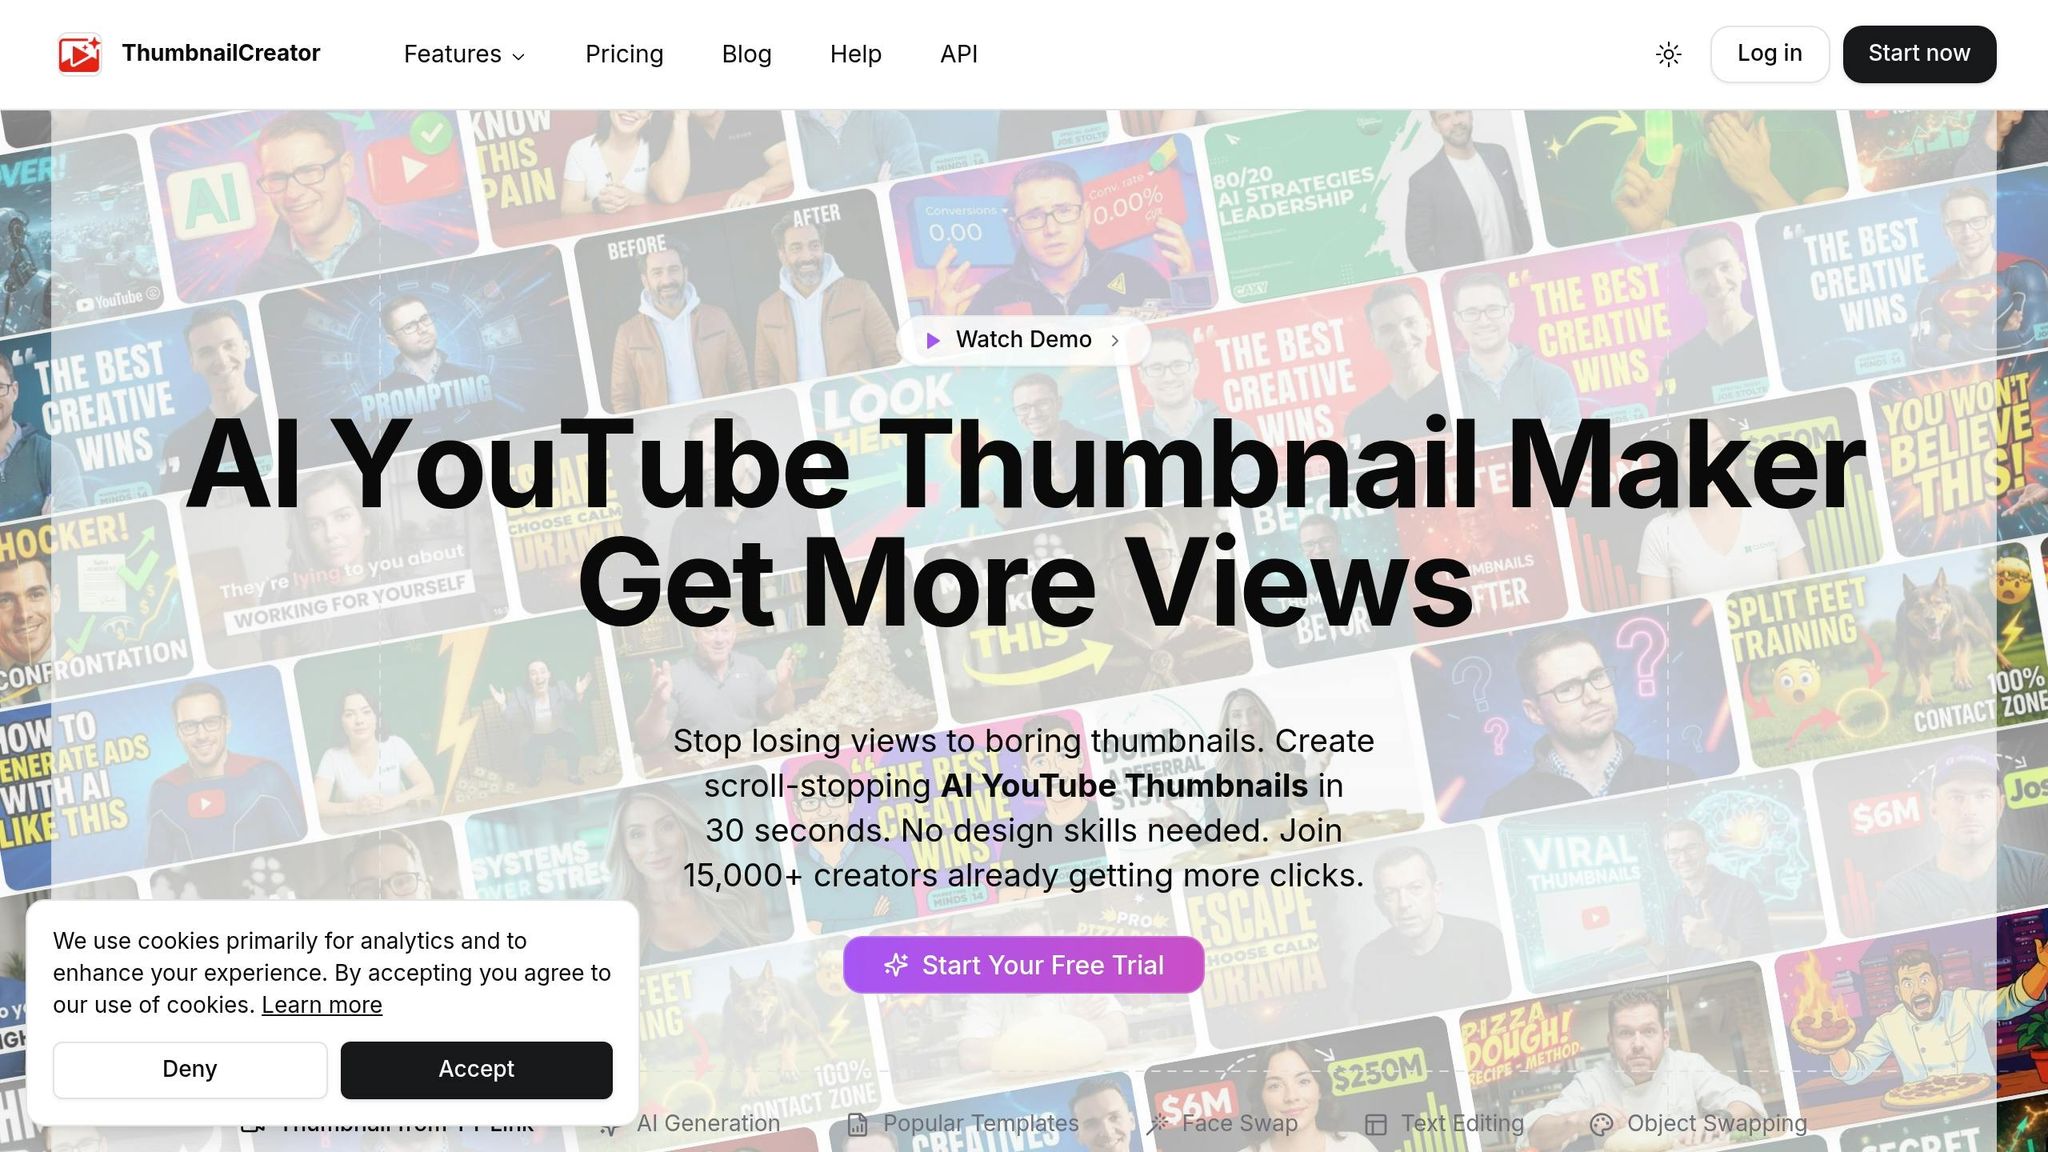
To streamline the process of creating and testing thumbnails, tools like ThumbnailCreator can save you time. Using its AI-powered features, you can generate multiple high-quality thumbnail concepts in seconds, letting you focus more on testing than on designing.
The platform also offers tools like face swaps and text editing, which are perfect for A/B testing. For example, you can take one design and quickly change facial expressions or tweak the headline text to create distinct versions without starting from scratch. With pre-built templates and these features, frequent testing becomes much easier. Creators who test consistently have reported CTR improvements of 3–7% on their most effective thumbnails.
Setting Up and Running Your A/B Test
Set Up the Test in YouTube Studio
YouTube Studio's Test & Compare tool is an effective way to conduct a thumbnail A/B test. It divides your audience into segments and shows each group a different thumbnail simultaneously, ensuring that factors like timing or seasonal traffic don’t affect the results.
To get started, log into YouTube Studio on your desktop (this feature isn’t available on mobile). Open the video you want to test, head to the Thumbnail section, and select Test & Compare. You can upload up to three thumbnail variations and finalize by clicking Done.
Keep in mind, this tool is only compatible with public long-form videos, podcast episodes, and completed livestream archives.
"Great thumbnails don't just get viewers to click. They also help viewers understand what the video is about, so that they can make informed decisions about what to watch." - YouTube
Interestingly, YouTube evaluates the winning thumbnail based on watch time share, not just click-through rate (CTR). This means a thumbnail with a lower CTR could still win if it attracts viewers who stay longer.
Once your test is live, avoid making any changes to the video that could interfere with the data.
Keep Your Test Valid
One common pitfall is ending a test too soon. For accurate results, let the test run for 7–14 days to account for both weekday and weekend traffic. Each thumbnail variant should also gather at least 1,000 impressions before you analyze the data.
During the test, keep all video metadata - such as the title and description - unchanged. The thumbnail should be the only variable. Changing other elements will invalidate your experiment and stop the test.
At the end of the test, YouTube will classify the results into one of three outcomes: Winner, No Significant Difference, or Inconclusive. If no clear winner emerges, YouTube will default to the first thumbnail you uploaded.
Run a Manual Test When Needed
If the Test & Compare feature isn’t available, you can opt for a manual A/B test. Start by recording baseline metrics like CTR, impressions, and view duration through YouTube Analytics.
Next, swap thumbnails on a consistent schedule - for example, every 48 hours or weekly. After each period, log the performance data for that specific thumbnail. Use the Compare to... feature in YouTube Analytics’ Advanced Mode to analyze performance across the different time windows.
Since manual tests are sequential (not simultaneous), factors like traffic patterns and timing can influence results. To reduce these variables, test each thumbnail on the same weekday and ensure that the title, description, and tags remain unchanged throughout the experiment.
Analyzing Results and Applying What You Learn
Evaluating the results of your A/B tests is key to understanding what resonates visually with your audience. This process ties directly to the objectives and hypotheses you set during the planning stage.
Read Your YouTube Studio Results
After running your test for 7–14 days and gathering at least 1,000 impressions per variant, head to the Test & Compare section in YouTube Studio to review the results. You’ll see outcomes labeled as Winner, No Significant Difference, or Inconclusive.
YouTube determines the winner based on watch time share, not just click-through rate (CTR). As YouTube explains:
"To help your video get high quality engagement, we optimize tests for overall watch time over other metrics, like click-through rate." - YouTube Support
If the results are inconclusive, consider creating more distinct thumbnail designs to make the differences clearer. Then, dig into the metrics to gain a more detailed understanding of performance.
Look at Metrics Together for a Clearer Picture
To fully assess your results, analyze detailed metrics that reflect both click and retention performance. While CTR measures how well your thumbnail grabs attention, retention metrics show how well it keeps viewers engaged. For example, a thumbnail with a high CTR but poor retention may underperform compared to one with slightly lower CTR but stronger retention.
This is especially important in 2026, as YouTube increasingly prioritizes satisfaction signals. If a thumbnail misrepresents the content, it can lead to a 30% drop in views and a 42% decline in video completion rates.
When reviewing test data in YouTube Studio's Advanced Mode, compare metrics like CTR, average view duration (AVD), and average percentage viewed side by side. A manual winner should only be confirmed if there’s a 15–20% performance difference between variants, as smaller differences might simply be statistical noise.
| Metric | What It Measures | Why It Matters |
|---|---|---|
| Watch Time Share | Total watch time earned by each variant | YouTube's main factor for determining a winner |
| CTR | Percentage of viewers who clicked | Indicates the thumbnail's initial appeal |
| AVD / Retention | How long viewers stayed after clicking | Ensures the thumbnail reflects the content |
| Impressions | Total times the thumbnail was shown | Confirms an adequate sample size |
Record What You Learn for Future Tests
Each test is an opportunity to gather insights. After every test, document the elements of the winning design, such as color schemes, text placement, font size, facial expressions, layout, and whether to use real photos or AI-generated images. Over time, you’ll identify patterns that reveal what works best for your audience.
When creating future thumbnails using ThumbnailCreator, apply these insights to guide your designs. For instance, if thumbnails with high-contrast backgrounds consistently outperform muted ones, start with that approach. Once you’ve identified a winning style, create a consistent template to help your audience easily recognize your content. You can also apply these successful design elements to older videos with high impressions, giving them another chance to perform well in YouTube’s algorithm.
"Deciding a 'winner' by watch time will best support creators' growth." - YouTube
Conclusion
Running thumbnail A/B tests takes patience and a structured approach. As outlined earlier, focus on videos with steady impressions but lower-than-expected CTR, craft a clear hypothesis, and create thumbnail variations that are visually distinct to yield actionable insights. Use YouTube Studio's Test & Compare tool, and ensure you gather enough data to make confident decisions.
While CTR is important, don’t overlook watch time share - YouTube’s key metric for determining success. authentic thumbnails that encourage viewers to stay engaged after clicking are the real winners in YouTube’s eyes.
By following these steps, you can turn testing into a powerful tool for improving your thumbnails. Documenting your results is essential. Following thumbnail design guides can help you interpret these results more effectively. It helps you identify patterns, such as which colors, facial expressions, text placements, or layouts resonate most with your audience. Over time, this shifts your process from guesswork to a repeatable, data-driven strategy.
"Individual test results are interesting. Patterns across 10+ tests are transformative." - thumbmentor.com
Tools like ThumbnailCreator make this process even smoother. With ThumbnailCreator, you can quickly generate fresh thumbnail variations designed to grab attention - no professional design skills required. As you refine your approach, your thumbnails will keep improving, leading to better engagement and higher click-through rates.
FAQs
How can I tell if my A/B test has enough data to trust the results?
To ensure your A/B test results are reliable, make sure each variant gathers at least 1,000 impressions (or 1,500–2,000 impressions for larger channels). Let the test run for a minimum of 7 days and confirm that the results achieve statistical significance (p-value < 0.05). Following these guidelines helps you identify genuine audience preferences instead of attributing outcomes to random chance.
What should I do if the test result is inconclusive or shows no difference?
If your A/B test doesn't show a clear winner or any major differences, it's best to stick with your original choice - usually the first thumbnail or title you uploaded. Before making any decisions, double-check that your test had enough data to be reliable. Aim for at least 1,000 impressions per variant and let the test run for at least 7 days.
If the results are still unclear, try testing smaller changes or focusing on individual elements. This approach can help you fine-tune your strategy and improve future results.
If CTR goes up but retention drops, should I still switch thumbnails?
If your click-through rate (CTR) goes up but your retention takes a big hit, switching thumbnails might not be the best move. YouTube prioritizes a combination of high CTR and strong retention because what really matters is the overall watch time per impression. A high CTR paired with low retention can come across as misleading, which could hurt your video's reach. Aim for thumbnails that boost both CTR and retention to keep viewers engaged and stay on YouTube's good side.