

7 YouTube Thumbnail Analytics Tools for Live CTR
Start with YouTube Studio for free launch-day CTR checks - and compare clicks with watch time before changing a thumbnail. “Live” means the latest available report, not instant tracking. Early CTR data can take a few hours to appear.
The seven options below range from free YouTube reports to paid testing tools and custom dashboards. Compare them by reporting delay, metrics, testing method, setup time, and cost.
Quick Comparison
| Tool | Main use | Timing and testing limits | Setup | Cost |
|---|---|---|---|---|
| YouTube Studio Analytics | Check CTR, impressions, and watch time | Early reports can take hours; figures may change | 5–10 minutes | Free |
| YouTube Test & Compare | Compare up to 3 thumbnails by watch-time share | Results take a few days to 2 weeks; not live CTR testing | 10–15 minutes | Free |
| TubeBuddy | Run thumbnail A/B tests alongside channel tools | Sequential rotations, roughly 24 hours apart | 15–30 minutes | Paid; confirm Legend pricing |
| vidIQ | Add monitoring and optimization tools | Metrics and testing access depend on the plan | 15–30 minutes | Free and paid plans |
| ThumbnailTest | Rotate thumbnails and compare variant results | Hourly or daily rotation; results need multiple cycles | 15–30 minutes | Paid; check billing and channel limits |
| Looker Studio + YouTube connector | Combine metrics in shareable reports | About 12-hour update intervals; source data can lag | About 1 hour | Standard reports free; connector fees may apply |
| YouTube Analytics API dashboard | Build custom historical reports | Roughly 24–72-hour processing delay; no built-in variant results | Hours to days | Development, hosting, and maintenance |
Prepare 2 or 3 thumbnails before publishing. Log each version and any swap time, compare similar traffic sources, and judge CTR alongside watch time - not on its own. This helps you identify thumbnail mistakes to avoid that might inflate clicks but hurt retention. For native Test & Compare experiments, leave the test unchanged until it finishes.
How to Use the YouTube A/B Thumbnail Tool (Test & Compare)
sbb-itb-b59debf
What Thumbnail CTR Measures
For launch-day checks, impressions CTR = views from impressions ÷ impressions × 100. A registered impression usually means the thumbnail appeared on screen for more than 1 second, with at least 50% visible. Eligible surfaces include Home, Search, subscriptions, and Suggested.
External sites, embeds, emails, notifications, cards, and end screens don’t create registered impressions. So don’t divide total views by impressions to calculate thumbnail CTR.
Views from impressions counts the views those impressions produced. Watch time from impressions tracks viewing time from those views, while average view duration shows how long viewers watched on average. High CTR paired with weak watch time points to a mismatch between the thumbnail and the video.
Traffic sources show where viewers came from. During launch, focus on Home (within Browse features), YouTube Search, and Suggested videos. Compare CTR by source when possible: the overall rate can hide differences in audience behavior. Record your source mix before changing a thumbnail, since a traffic shift can move CTR even when the thumbnail stays the same.
The tools below show these traffic-source and watch-time signals during launch. They vary in update speed, metrics, and testing method, from summary tools to variant testers and dashboards that bring YouTube data together. Next, compare the seven tools by speed, setup, cost, and variant testing.
1. YouTube Studio Analytics
CTR, Impressions, and Watch Time
YouTube Studio is a free starting point for launch-day CTR checks. Open Analytics → Content for channel-wide data or Analytics → Reach for a single video. You’ll see impressions, CTR, views from impressions, and watch time from impressions. Check this report first, then compare readings after the first batch of impressions comes in.
Reporting Delays and Launch Limits
Studio updates in batches, so launch-day CTR can change for several hours. Record your first reading in a spreadsheet, then check again later in the same reporting window before changing the thumbnail.
Thumbnail Testing and Channel Access
Test & Compare lets you test up to 3 thumbnail variants. It chooses the winner by watch time share - not CTR. You’ll need desktop Studio, advanced features enabled, and eligible content. Shorts, scheduled live streams, private videos, and certain restricted content aren’t eligible.
Check channel permissions before launch so analysts can view reports and only authorized users can change thumbnails.
Setup Time and Cost
Setup takes 5–10 minutes, and the price is $0. Reporting delay is its main launch-day limit. The next section covers Test & Compare’s dedicated variant reporting for side-by-side thumbnail tests.
2. YouTube Test & Compare
Watch-Time Testing, Not Live CTR
Use Test & Compare to check thumbnail performance after launch - not to track live CTR. It picks a winner based on watch-time share. To put the results in context, check Studio’s overall impressions CTR, views, and average view duration. This data is essential for advanced thumbnail optimization and long-term growth. Tests can take a few days to two weeks, and low-traffic videos may finish without a clear winner.
Thumbnail Testing and Channel Access
Open the thumbnail testing option on an eligible video in YouTube Studio, then upload up to 3 thumbnail variants. The tool supports public long-form videos, eligible podcast episodes, and saved livestream archives.
Setup Time and Cost
Allow 10–15 minutes for setup. Keep the title unchanged, and make sure the thumbnails look clearly different from one another, as A/B testing vs gut feeling results often favor distinct visual variations. Cost: $0. For faster launch-day monitoring, the next tool updates sooner than this experiment does.
3. TubeBuddy
Thumbnail Testing and Reporting Delays
TubeBuddy adds thumbnail A/B testing to its channel workflow tools. You can compare variants using CTR, impressions, and watch time per impression. It’s useful for launch-day comparisons, but not for tracking instant reactions.
TubeBuddy updates more slowly than YouTube Studio. Expect roughly 24 hours between variant rotations. That means changes in traffic mix and launch timing can skew results. Reported winner thresholds also vary by account and test.
Thumbnail Testing and Channel Access
Full thumbnail A/B testing is generally tied to Legend, not Pro. Before subscribing, check availability for your channel, video type, and region. Make sure the plan covers every channel you manage.
Setup Time and Cost
Setup takes 15–30 minutes. Connect your channel, choose an eligible video, and upload different thumbnail variants. Check current Legend pricing before subscribing.
If you need faster dashboard snapshots rather than a test-based workflow, the next tool takes less effort to run.
4. vidIQ
CTR, Impressions, and Watch Time
vidIQ adds a light layer of launch-day monitoring alongside YouTube Studio, with context on CTR, impressions, watch time, and retention. Check which metrics your plan includes before launch, and read CTR alongside viewing duration.
Reporting Delays and Launch Limits
Record a baseline, then check the same reporting window in YouTube Studio before changing your thumbnail. Look at traffic sources and audience mix to help explain CTR changes. Treat vidIQ as a guide - not an instant CTR feed.
Thumbnail Testing and Channel Access
Before checking variants, confirm that testing is available for your plan, channel, region, and video type. Thumbnail scoring is not a controlled A/B test. Manual before-and-after comparisons can suggest a pattern, but they don’t establish cause and effect.
Setup Time and Cost
Set aside 15–30 minutes to authorize the intended Google account, review permissions, check that recent videos appear, and record your thumbnail and CTR baseline.
U.S. pricing: Free costs $0; Boost costs $19/month or $199/year; Max costs $49/month or $468/year. Before subscribing, check the final checkout price, channel limits, and included analytics.
For a workflow centered on testing, the next tool handles variant analysis directly.
5. ThumbnailTest
CTR, Impressions, and Watch Time
ThumbnailTest rotates thumbnails on a live video for launch-day testing. It reports CTR, impressions, and views for each variant. Watch time may also appear, but check whether it applies to each variant or the video as a whole.
Reporting Delays and Launch Limits
Hourly rotation doesn’t mean instant results. Results may take several cycles to settle. Each variant needs at least 1 hour in hourly mode or 1 day in daily mode. Low-traffic launches need longer testing windows.
Thumbnail Testing and Channel Access
Connect through Google OAuth, select a video, upload labeled variants, and choose hourly or daily rotation. Check that your plan supports your chosen schedule. You can run only one active test per video.
Variants run one after another, so changes in traffic mix and time of day can skew the results.
Setup Time and Cost
Allow 15–30 minutes for setup if your thumbnails are ready. ThumbnailTest is best suited to creators who test often. Small channels may not get enough impressions to draw a firm conclusion.
Public pricing runs from $10 to $99 per month, depending on channel count and billing. Before subscribing, check the checkout price, channel limits, and cancellation terms.
For live variant rotation, run your test in ThumbnailTest, then compare the result with Studio’s CTR snapshot.
6. Looker Studio with a YouTube Analytics Connector
After testing, bring your launch metrics together in one Looker Studio dashboard.
CTR, Impressions, and Watch Time
Use Google’s YouTube Analytics connector in Looker Studio to build shareable video or channel reports. Track impressions CTR, views, watch time, and average view duration when those fields are available.
Reporting Delays and Launch Limits
This isn’t a live CTR dashboard. The connector refreshes about every 12 hours, and API-based reports can lag until all requested metrics are available. Check YouTube Studio on launch day, then use Looker Studio to bring the results together afterward.
Thumbnail Testing and Channel Access
Connect a Google account that owns or manages the channel. Before sharing the report, check that you’ve selected the right channel and permissions.
Setup Time and Cost
Set aside about 1 hour to connect the account, choose fields, build a video table, and add date filters. Standard Looker Studio reports are free, but paid partner connectors may cost extra.
With the dashboard built, prepare your thumbnail variants before launch.
7. YouTube Analytics API Custom Dashboard
Teams that need more automation than Looker Studio can build directly on the YouTube Analytics API. It offers the most flexibility but takes the longest to get running. It’s built for custom reporting and control over historical data - not first-hour CTR decisions.
CTR, Impressions, and Watch Time
A custom dashboard gives technical teams full control over launch metrics. Use reports.query calls to pull views, watch time, average view duration, and reach metrics when available. If CTR is unavailable, mark it N/A. Don’t estimate it from total views.
Reporting Delays and Launch Limits
This is post-launch reporting, not live tracking. Allow roughly 24–72 hours for processing. Pull data once or twice daily and display the latest complete date alongside the retrieval time. Mark recent figures as provisional, cache older results, retry failed requests, and monitor quotas in Google Cloud Console.
Thumbnail Testing and Channel Access
Use OAuth 2.0 with the read-only https://www.googleapis.com/auth/yt-analytics.readonly scope. An API key alone won’t work. The creator or team member connecting the dashboard must approve access through a Google account that owns or manages the channel.
Log each variant name and swap time manually. The API doesn’t link results to thumbnail variants. Before-and-after comparisons are observational only: changes in audience mix, traffic sources, and video age can affect the results.
Setup Time and Cost
Plan for several hours to build a one-channel prototype and several days for a stable multi-channel dashboard. Costs depend on development, storage, hosting, monitoring, and maintenance. This option suits technical creators, agencies, and teams that need centralized historical data and integrations.
Before launch, label each thumbnail variant and log its swap time to give the dashboard clean baseline data.
Prepare Thumbnail Variants Before Launch
Prepare 2 or 3 thumbnail variants before publishing, changing one main design element in each. Keep a simple change log with each variant’s name, exact text, subject scale, contrast, background color, facial expression, and composition. Use it during launch-day CTR checks.
Check each thumbnail on mobile. The subject should be easy to recognize and the text easy to read. Remove details that disappear at small sizes, and make sure UI elements won’t cover anything important. Save editable source files alongside final exports, and use a design tool if needed to produce the final files.
ThumbnailCreator can help you create and edit testable variants faster. After exporting, log each version’s variant name and launch or swap time.
Track launch metrics in YouTube Studio or a trusted dashboard. Record the traffic source and impression count with each reading, and link it to your change log. This helps separate variant performance from traffic changes during live CTR checks.
Judge each variant by watch time, not CTR alone.
How to Monitor CTR on Launch Day
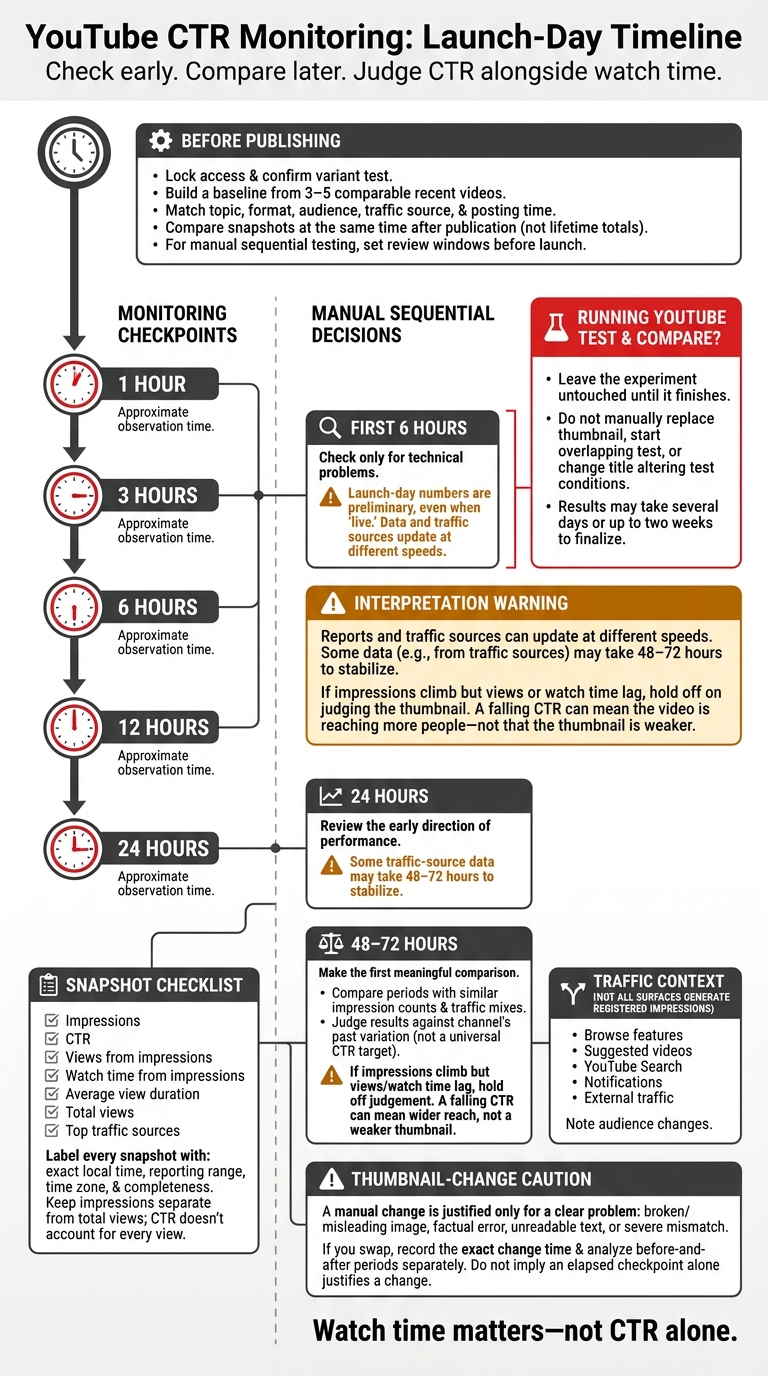
YouTube CTR Monitoring: Launch-Day Timeline
Before publishing, lock access, confirm the variant test, and build a baseline from 3–5 comparable recent videos. Match the topic, format, audience, traffic source, and posting time. Compare dashboard snapshots at the same time after publication - not lifetime totals.
Set checkpoints at roughly 1, 3, 6, 12, and 24 hours after publishing. At each checkpoint, record impressions, CTR, views from impressions, watch time from impressions, average view duration, total views, and top traffic sources. Label every snapshot with the exact local time, reporting range, time zone, and whether the report is complete.
Treat launch-day numbers as preliminary, even when the dashboard says “live.” Data can update at different speeds across reports and traffic sources. Some traffic-source data may take 48–72 hours to stabilize. If impressions climb but views or watch time lag, hold off on judging the thumbnail. Check the traffic mix - Browse features, Suggested videos, YouTube Search, notifications, and external traffic - and note any audience changes. A falling CTR can mean the video is reaching more people, not that the thumbnail is weaker. Keep impressions separate from total views, too: thumbnail CTR doesn’t account for every view.
If you’re running a native YouTube Test & Compare experiment, don’t manually replace the thumbnail, start an overlapping test, or change the title in a way that alters test conditions. Leave the experiment untouched until it finishes. This is especially critical when managing thumbnail testing at scale across multiple channels. Results may take several days or up to two weeks to finalize.
For manual sequential testing, set your review windows before launch:
- First 6 hours: Check only for technical problems.
- 24 hours: Review the early direction of performance.
- 48–72 hours: Make the first meaningful comparison.
Compare periods with similar impression counts and traffic mixes. Judge thumbnails against your channel’s past variation, not a universal CTR target. A manual change is justified only when there’s a clear problem, such as a broken or misleading image, a factual error, unreadable text, or a severe mismatch between the thumbnail and video.
If you swap thumbnails, record the exact change time and analyze the before-and-after periods separately. Use these checkpoints when judging the speed differences in the tool comparison.
Tool Comparison: Metrics, Reporting Delays, Setup, and Cost
Compare live-monitoring tools by reporting speed, setup time, cost, and testing depth. “Unverified” means the supplied sources don’t confirm the feature. Use these details to find a tool that fits your launch workflow.
| Tool | Best for | Metrics covered | Refresh speed vs. data delay | Testing method | Channel limits | Setup time | Cost | Main limitation |
|---|---|---|---|---|---|---|---|---|
| YouTube Studio Analytics | Small creators getting started | Impressions, CTR, views, and watch time. | Near-live dashboard; data settles over 24–48 hours. | No native testing in this view | Unverified | 5–15 minutes | Free reporting | Data may still be processing. |
| YouTube Test & Compare | Native thumbnail experiments | Watch-time share; CTR doesn’t select the winner. | Not a live dashboard | Native thumbnail comparison | Unverified | 10–20 minutes | Native testing; commercial terms unverified | Scores watch time, not CTR. |
| TubeBuddy | Testing alongside creator tools | CTR and watch-time coverage unverified | Refresh and delay undocumented | Paid A/B testing | One channel per license. | 15–30 minutes | Pro: $12–$15/month; Legend: $31–$33/month; annual discounts. | Testing requires an eligible paid plan. |
| vidIQ | A broader set of optimization tools | CTR and watch-time coverage unverified | Refresh and delay undocumented | Paid testing reported; rotation unverified | Unverified | 15–30 minutes | Subscription; pricing unverified | Confirm metrics, access, and reporting delay before buying. |
| ThumbnailTest | Automated thumbnail rotation | CTR and views; watch time unverified. | Refresh and delay undocumented | Hourly or daily rotation. | Entry plan: one channel. | 15–30 minutes | Entry: $24–$29/month; higher tiers: $45–$49 or $75–$99/month. | Recurring cost; requires authorized access. |
| Looker Studio + YouTube Analytics connector | Combined reports | CTR and watch time, if the connector exposes them | About 12-hour refresh; underlying data can lag by about 3 days. | No independent testing | Connector-dependent | 30–90 minutes | Dashboard may be free; cited connector offers free and paid plans, with paid plans starting at $19/month. | Connector reliability and quotas. |
| YouTube Analytics API custom dashboard | Creators with technical help | Views and watch time; CTR depends on available fields. | Developer-set refresh; 48–72-hour data delay. | Custom development required | Unverified | Hours for a prototype; days for production | Engineering, hosting, and maintenance | Requires continued technical work; reporting is delayed. |
Setup estimates assume you have account access and thumbnails ready. Connector setup also includes field mapping. API dashboards require channel-owner OAuth - an API key isn’t enough. Prices are budget ranges, not quotes.
Once you’ve picked a tool, prepare two or three thumbnail variants before publishing.
Conclusion: Start With YouTube Studio
After comparing the tools, the simplest launch-day workflow starts in YouTube Studio: compare CTR with watch time from impressions.
For a formal thumbnail test, use Test & Compare to validate your choice - not to track instant reactions. Results can take several days to two weeks.
Turn to third-party tools only when Studio’s built-in reports fall short. Pay for testing tools only if they meet a specific workflow need. Looker Studio connections and custom dashboards can organize your reporting, but they won’t make YouTube’s underlying data arrive faster.
A CTR spike from a different audience isn’t enough reason to switch. For launch-day decisions, watch time beats click spikes.
FAQs
How many impressions do I need for a reliable thumbnail test?
Aim for at least 1,000–2,000 impressions per thumbnail variation. Getting 1,500–5,000 per variation can improve statistical confidence and reduce false positives. For the most dependable data, target 10,000 total impressions.
Whatever the impression count, let tests run for 7–14 days to account for weekly traffic fluctuations.
What if CTR improves but watch time drops?
A higher CTR isn’t always a win. If watch time drops as clicks increase, your thumbnail may promise more than the video delivers - or set the wrong expectations. That mismatch can feel like clickbait, prompting viewers to leave early and potentially hurting your long-term reach.
Prioritize watch time share over raw CTR when judging performance. Your thumbnail and title should accurately reflect the video. Instead of sticking with a thumbnail that gets clicks but loses viewers, test designs that better match your content.
How can I test thumbnails on a low-traffic channel?
Use YouTube Studio’s desktop Test and Compare feature with Advanced features enabled. Upload up to three thumbnail versions, and keep the video title the same throughout the test.
Aim for 1,000–2,000 impressions per version, with 10,000 total impressions as the ideal target. Run the test for 7–14 days to include weekdays and weekends. Don’t make a decision in the first 24–48 hours.
If the feature isn’t available, swap thumbnails manually. Compare results across equivalent time windows and traffic sources.