

Lessons from AI Thumbnail Case Studies
AI thumbnail tests can lift clicks, views, revenue, and save time - but only if you track the right numbers and test one change at a time.
If I had to sum up the article in plain English, it’s this:
- CTR is the first number to watch
- View and revenue lift show whether more clicks turn into more money
- Time saved matters too, because shaving 20 to 35 minutes per thumbnail adds up fast
- The best-performing changes were simple: clearer faces, shorter text, stronger contrast, and less clutter
- More clicks alone are not enough if watch time drops after the click
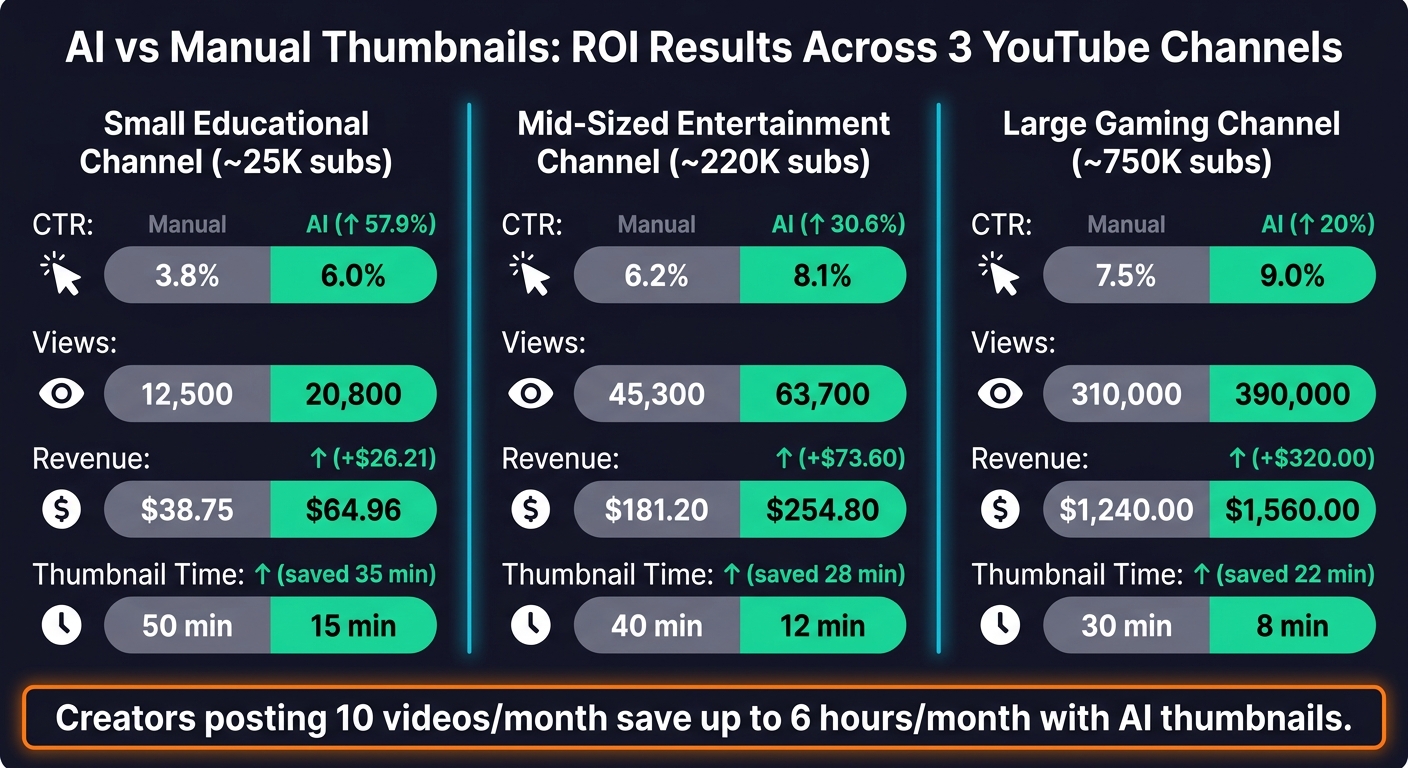
A few numbers stood out right away. In the case studies, CTR moved from 3.8% to 6.0%, 6.2% to 8.1%, and 7.5% to 9.0%. That led to view growth and revenue gains from about $26.21 on a small channel to $320.00 on a large one. On the workflow side, AI cut thumbnail time from 50 minutes to 15 minutes, 40 to 12, and 30 to 8.
What do I take from that? AI did not win by magic. It won because creators used a clear process:
- set a baseline
- test the same video
- swap one thumbnail variable at a time
- compare CTR, views, revenue, and time saved
- keep the versions that got more clicks without hurting watch time
Here’s the short version of the three cases:
| Case | CTR Change | Views/Revenue Change | Time Saved |
|---|---|---|---|
| Educational channel | 3.8% → 6.0% | 12,500 → 20,800 views / +$26.21 | 35 min |
| Entertainment channel | 6.2% → 8.1% | $181.20 → $254.80 / +$73.60 | 28 min |
| Gaming channel | 7.5% → 9.0% | $1,240.00 → $1,560.00 / +$320.00 | 22 min |
The core lesson is simple: use AI to make more thumbnail versions, test them with a clean setup, and judge the result by business numbers - not gut feel. That’s the main point the article keeps proving from start to finish.
Baseline Data and Testing Method
Starting Data for Each Channel
Once the metrics were set, the next step was to lock in a baseline before changing any thumbnail. That baseline tracked CTR, average first-30-day views, thumbnail production time, and estimated ad revenue.
Here’s a simple example. Take a mid-sized U.S. educational channel with 85,000 subscribers. Before any changes, it averaged 4.8% CTR across its last 12 uploads and 35,000 views in the first 30 days. The creator spent about 1 hour per thumbnail using a AI thumbnails vs manual design workflows. With an RPM of $3.50, a video with 28,000 views would bring in about $98 in ad revenue. That gives you a clean starting point, so any shift from the thumbnail is easier to spot.
Channel size also changed how the baseline was read. Smaller channels with fewer than 10,000 subscribers often swing more from week to week, so a 60- to 90-day baseline window tends to be safer than a 28-day one. Bigger channels with steadier traffic can usually work with a shorter 28- to 30-day window.
How the Thumbnail Comparisons Were Run
The case studies used two testing methods: YouTube's built-in Test & Compare tool and sequential thumbnail swaps.
YouTube's Test & Compare tool lets creators test up to three thumbnail versions and selects a winner based on watch-time share. In these case studies, though, sequential swaps showed up more often. The original thumbnail stayed live for a fixed window, usually 10 to 14 days, and then the AI-made version replaced it for an equal-length window.
To keep the test clean, each run avoided outside noise like major holidays, news spikes, or unrelated traffic jumps on the channel. Results were also checked against other uploads from the same time period, which helped stop a channel-wide bump from being blamed on the thumbnail change.
There was one rule throughout: change one variable at a time. If you change several things at once, it becomes hard to tell what caused the result. One variable at a time keeps the outcome tied to the thumbnail itself.
With the test method locked, the next step is the AI workflow used to make the new thumbnails. Establishing a thumbnail workflow ensures these tests remain consistent and scalable.
sbb-itb-b59debf
AI Thumbnail Workflow Used in the Case Studies
Design Variables Changed in the AI Thumbnails
With the test method locked in, the case studies focused on a simple question: which thumbnail changes led to more clicks?
To answer that, each test changed only one thumbnail variable at a time: face, expression, text, background, color, framing, or hierarchy. That matters because the video itself stayed the same. So when CTR moved, it was much easier to tie that change back to the thumbnail.
In plain terms, creators tested things like a neutral face against a more surprised one, cut thumbnail text down to a few words, or swapped a messy background for something cleaner and darker. Those small visual shifts had a clear effect in the data.
A 2026 analysis of 1,000 YouTube thumbnails found that thumbnails with a human face averaged 6.8% CTR versus 4.1% CTR for faceless designs, which is about a 66% relative difference. In another case study, a face-forward, high-contrast redesign pushed CTR from 4.1% to 6.8%, increased impressions from 48,200 to 61,700, and boosted daily views from 120 to 310.
The table below shows the patterns that kept showing up in the case studies when higher performers were compared with weaker ones:
| Design Element | Higher-Performing Pattern | Lower-Performing Pattern |
|---|---|---|
| Face | Expressive, tightly cropped | Neutral, small, or absent |
| Text | 3–5 words, large, high-contrast | Long sentences, small, low-contrast |
| Background | Clean, blurred, or darkened | Busy, cluttered, visually noisy |
| Composition | One clear focal point | Multiple competing elements |
Framing and visual hierarchy mattered too. Tight close-ups tended to do better on personality-driven channels. Wider frames that showed charts, results, or tools worked better for instructional content. Layouts where the face took up about 40%–60% of the frame worked well for entertainment channels, while text-first or outcome-first layouts - where a bold number like "+35% CTR" or "$10K" pulled the eye first - did better for finance, tutorial, and fitness content.
Where ThumbnailCreator Fits in the Workflow
The workflow followed six steps: define the promise, gather assets, generate variants, shortlist, test, and document. In that process, ThumbnailCreator handled the fastest-moving part: generating variants and making quick edits.
Instead of building every thumbnail from zero, creators used ThumbnailCreator to spin up multiple directions from a simple prompt. Then they refined the best options with tools like face swapping, background cleanup, and object swapping. They could also adjust text length, font size, and color contrast fast, without digging into manual design work. On top of that, it can analyze a YouTube video URL and generate multiple thumbnail variations, which makes it easier to tweak or regenerate certain elements as needed.
That shift cut design time from hours to minutes and made multi-variant testing practical for each upload. Those workflow choices set up the performance results in the next section.
I Tested AI Thumbnails vs Manual Design (CTR Results)
ROI Results by Case Study
AI vs Manual Thumbnails: CTR, Revenue & Time Saved Across 3 YouTube Channels
Before-and-After Performance by Case
The three cases below are composites based on real channel patterns, and the numbers stay within observed ranges.
Using the workflow above, each case compares manual thumbnails with AI-assisted versions on the same videos. That matters, because it gives a cleaner before-and-after view instead of mixing in other changes.
Case 1 – Small Educational Channel (~25,000 subscribers). The channel moved away from low-contrast screenshots and switched to AI-assisted thumbnails with a close-up instructor face, bold 4-word text, and a high-contrast background. CTR went from 3.8% to 6.0%, and views increased from 12,500 to 20,800 over 30 days.
Case 2 – Mid-Sized Entertainment Channel (~220,000 subscribers). The team replaced busy collages with a single dominant face, a clean backdrop, and a short hook phrase. CTR increased from 6.2% to 8.1%, and revenue grew from $181.20 to $254.80 over 28 days.
Case 3 – Large Gaming Channel (~750,000 subscribers). The channel swapped dark in-game screenshots for bright character close-ups, object swaps that highlighted key items, and punchy text. CTR rose from 7.5% to 9.0%, and revenue increased from $1,240.00 to $1,560.00 over 60 days.
ROI Metrics Comparison Table
The table below puts all three cases side by side across the metrics that matter most for creator ROI.
| Case | Baseline CTR | AI CTR | Baseline Views | Post-Change Views | Baseline Revenue | AI Revenue | Revenue Change | Manual time per thumbnail | AI time per thumbnail | Time Saved |
|---|---|---|---|---|---|---|---|---|---|---|
| Educational (~25K subs) | 3.8% | 6.0% | 12,500 | 20,800 | $38.75 | $64.96 | +$26.21 | 50 min | 15 min | 35 min |
| Entertainment (~220K subs) | 6.2% | 8.1% | 45,300 | 63,700 | $181.20 | $254.80 | +$73.60 | 40 min | 12 min | 28 min |
| Gaming (~750K subs) | 7.5% | 9.0% | 310,000 | 390,000 | $1,240.00 | $1,560.00 | +$320.00 | 30 min | 8 min | 22 min |
The performance lift is one side of the story. The time savings add up fast too.
A creator who posts 10 videos per month and saves 35 minutes per thumbnail gets back nearly 6 hours per month. That’s time they can put into scripting, editing, or talking with their audience.
The table shows the lift. The next section breaks down which thumbnail traits drove it.
What Drove Better Results and Key Lessons for Creators
Thumbnail Traits Most Often Linked to Higher Performance
Better results came from a handful of repeatable patterns, not from AI by itself. Across the case studies, the thumbnails with the highest CTR kept showing the same five traits: clear faces, strong emotion, high contrast, short text, and clean composition.
Faces mattered a lot. Thumbnails with expressive faces beat faceless designs by about 25% to 50% in CTR, and the lift was strongest when the emotion fit the actual tone of the video. For entertainment content, surprise and excitement helped drive clicks. For education and finance channels, calm, engaged expressions worked better than shock-heavy faces. Short text also kept winning. When text stayed at four words or fewer, it beat longer phrases again and again, with short text driving about a 30% higher click rate than full sentences.
There’s a catch, though: niche still matters. A thumbnail style can lift CTR and still hurt long-term ROI if the tone clashes with the content itself.
How to Apply These Lessons Without Overgeneralizing
Once you know which traits tend to win, the next move is to turn them into a simple system. Use a small set of templates, test one variable at a time, keep the winner, and use it again. If you change just one element per test - like an emotional face instead of a neutral one, or a high-contrast background instead of a darker screenshot - you get a cleaner read on what caused the shift.
CTR tells part of the story, but not all of it. The best ROI came from thumbnails that lifted CTR without dragging down watch time or RPM. Some thumbnails get more clicks, then pull in viewers who leave fast. That can hurt recommendation performance over time. Looking at CTR next to average view duration and RPM across several uploads gives you a much better sense of whether a thumbnail style is actually working. ThumbnailCreator can help speed up that feedback loop with face swaps, contrast tests, and text-layout variants built from one base template.
FAQs
How long should I test one thumbnail before changing it?
For the most reliable results, run a thumbnail test for 5 to 14 days. That gives you enough time to smooth out the usual swings between weekday and weekend traffic.
Try not to end a test in less than 48 hours. And before you swap in a new version, make sure each thumbnail has picked up at least 1,000 to 5,000 impressions. That way, you're working with data you can trust a bit more.
What metrics matter most besides CTR?
CTR matters, but it shouldn’t be the only metric you track. If you want to understand performance and ROI, you need to pair it with post-click metrics that show whether your thumbnail is bringing in the right viewers.
Key metrics include Average View Duration (AVD), watch time, impressions, RPM, CPM, and engagement signals like comments, shares, and subscriber conversion rates.
How do I know if a higher-CTR thumbnail is actually hurting performance?
A higher CTR can actually hurt performance if the thumbnail is misleading and doesn’t line up with what viewers expect.
That’s why you need to check Average View Duration (AVD) and audience retention alongside CTR. If CTR goes up but AVD drops hard, that’s a red flag. And if more than 40% of viewers leave in the first 30 seconds, your thumbnail is probably promising more than the video delivers.
In plain English: the click looks good, but the watch doesn’t. When that happens, reach can shrink and long-term channel performance can take a hit.