

CTR Tracking for Thumbnails: FAQs Answered
Thumbnail CTR can help you spot packaging problems fast, but it should never be read alone. I’d use it as an early signal, then check it next to watch time, retention, traffic source, and total impressions before making a change.
Here’s the short version:
- CTR measures clicks after an impression, not whether the video itself is good.
- Early CTR can swing for 24 to 72 hours as YouTube tests the video with different groups.
- Wait for about 300 to 500 impressions before I treat the number as useful.
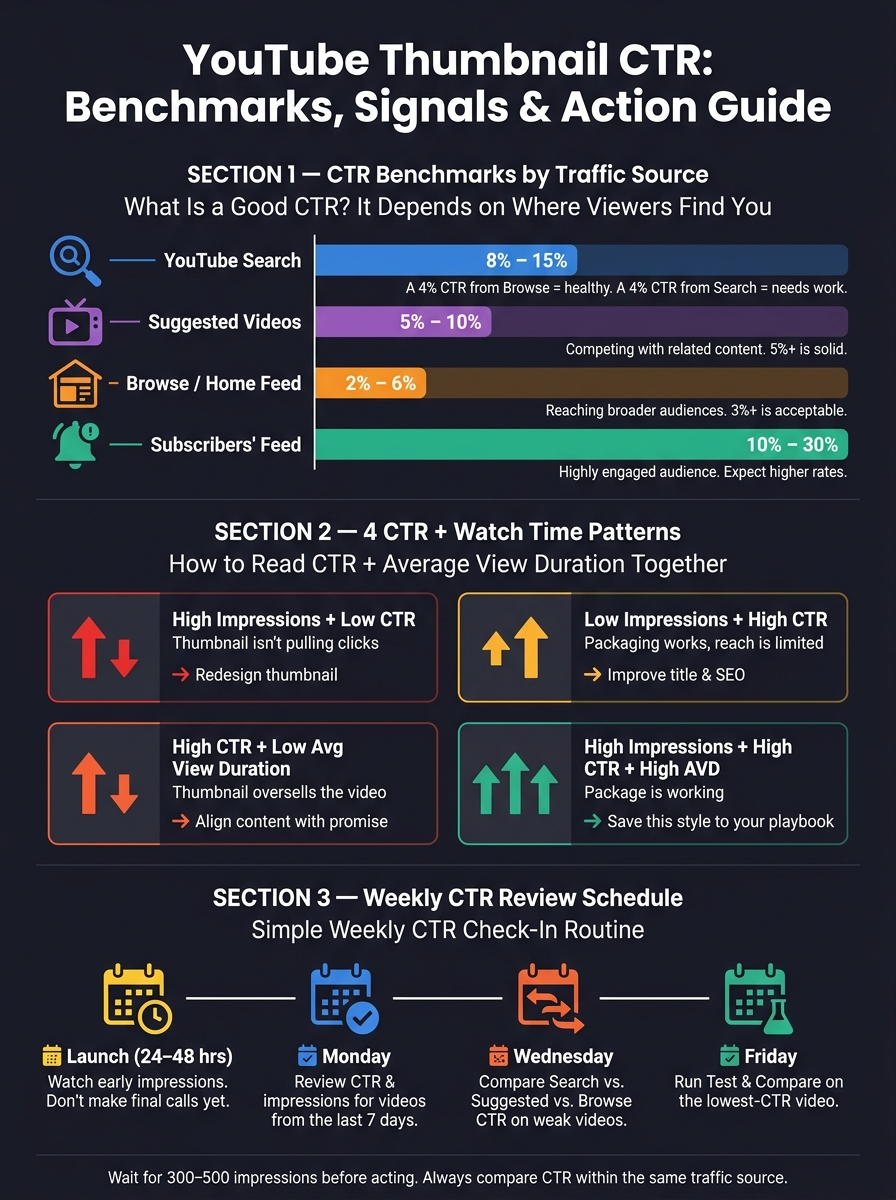
- A “good” CTR depends on traffic source:
- Search: 8%–15%
- Suggested: 5%–10%
- Browse/Home: 2%–6%
- Subscriber feed: 10%–30%
- High CTR + low retention often means the thumbnail or title promised too much.
- Low CTR + strong retention can mean the video works, but the packaging needs work.
- Use Test & Compare when possible, or do manual swaps one change at a time.
- Check trends weekly, not every few hours.
A thumbnail that gets clicks but loses viewers is not doing its job. And a thumbnail with a lower CTR on Home than in Search may be doing just fine. That’s the big idea: I’d treat CTR as a clue, not a final answer.
If I had to boil the whole topic down to one rule, it would be this: compare CTR by traffic source, give the data time, and match every click with watch time data before changing anything.
YouTube Thumbnail CTR by Traffic Source: Benchmarks & Action Guide
How to Test YouTube Thumbnails to Boost CTR | Test & Compare Tutorial
How thumbnail CTR works in YouTube analytics
CTR only helps when YouTube counts an impression the same way you think it does.
What counts as an impression and how CTR is calculated
YouTube only counts an impression when a thumbnail is visible for more than 1 second and at least 50% of it is on screen. So if someone scrolls past too fast, or sees your video outside YouTube, that does not count.
The formula itself is easy: CTR = (Clicks ÷ Impressions) × 100. If your thumbnail appears 1,000 times and 50 people click, your CTR is 5%. Simple math.
But here’s the catch: CTR measures the thumbnail-title package, not just the thumbnail on its own. If the image is strong but the title feels weak, CTR can still drop. Same deal the other way around.
The math is clear. The harder part is knowing when the data is current enough to lean on.
What real-time means for views versus CTR
Impressions and CTR in YouTube Studio usually trail views by a few hours. That’s why early numbers can feel a little off.
YouTube Studio updates data at two different speeds:
- The key metrics card refreshes more often
- The detailed "Impressions and how they led to watch time" report updates more slowly
That gap matters. If a thumbnail looks weak in the first few hours, the CTR may not be fully caught up yet. In plain English: don’t panic too soon.
What a typical CTR range looks like
Traffic source changes what a “good” CTR looks like. A number that feels low in one place can be perfectly fine in another.
| Traffic Source | Typical CTR Range |
|---|---|
| YouTube Search | 8% – 15% |
| Suggested Videos | 5% – 10% |
| Browse Features (Home) | 2% – 6% |
| Subscribers' Feed | 10% – 30% |
A 4% CTR from Browse can be perfectly healthy. A 4% CTR from Search will usually lag behind where you want it to be.
That’s why source-by-source comparison matters so much. Check CTR by traffic source first, then compare each video against your channel’s own average.
Once CTR makes sense by source and timing, the next move is finding the right report in YouTube Studio.
Where to track thumbnail CTR in YouTube Studio
Once you understand how CTR tends to move, the next step is simple: find the metric in YouTube Studio and check it in the right places. You can track CTR at both the channel level and the video level.
How to find channel-level and video-level CTR
YouTube Studio shows CTR in two main views.
For channel-level CTR, go to YouTube Studio → Analytics → Content. Then open the Key metrics card or the "Impressions and how they led to watch time" report.
For video-level CTR, go to Content, open a video, and select Analytics → Reach.
That split matters. Channel-level CTR gives you a broad view of how your thumbnails are doing across the channel. Video-level CTR helps you zoom in and see which specific videos are pulling their weight - and which ones may need work.
How to filter CTR by date range and traffic source
If you want cleaner insight, don’t look at CTR as one big number. Break it apart by traffic source and date range.
Use Traffic source types to compare Search, Suggested, and Browse/Home. In the Reach tab, this lets you see how a thumbnail performs on each surface.
For time periods, use the date picker in the top-right corner of YouTube Studio. You can switch between the first 24 hours, 7 days, 28 days, or a custom window. This helps you see whether CTR changed as impressions started reaching broader audiences.
A thumbnail might look strong early on, then dip once YouTube shows it to more people. That’s normal. The date filter helps you catch that pattern instead of reacting too fast.
A simple review schedule
Checking CTR too often can add noise, so a weekly cadence usually works better.
Once you can filter by source and date, use a simple schedule to spot weak thumbnails before they drag down a video for too long.
| Check-In | Timing | What to Look At |
|---|---|---|
| Launch check | First 24–48 hours | Early impressions; avoid making a final call |
| Weekly review | Monday | CTR and impressions for videos published in the last 7 days |
| Traffic-source check | Wednesday | Compare Search, Suggested, and Browse/Home CTR on underperforming videos |
| Thumbnail action | Friday | Use Test & Compare to test a new thumbnail on the lowest-CTR video |
This kind of routine keeps you from staring at the dashboard every few hours. You still stay close to the data, but you’re less likely to overreact to a small swing.
sbb-itb-b59debf
How to monitor and act on CTR during a video launch
What to watch in the first 24 to 72 hours
Right after you publish, YouTube will often test the video with a small, highly relevant group first. That means early CTR can look higher than it will later. So in the first two to three days, watch the trend instead of rushing to a final judgment.
Give the video time to collect several hundred impressions before you make changes. If impressions are going up and CTR stays steady, that's usually a good sign. But if CTR keeps sliding, look closer. The problem may be distribution, or it may be a thumbnail that doesn't match what people expect.
Traffic source matters here too. A video can post a strong CTR in Notifications and still struggle in Browse. That kind of split tells you a lot. It helps you see whether the thumbnail is weak across the board or only on colder surfaces where viewers don't already know your content. Once you know where those early impressions are coming from, compare CTR with watch time before changing anything.
When a CTR drop actually matters
A drop in CTR isn't always bad news. As YouTube starts showing the video to more people, CTR often falls a bit. That's normal. It turns into a concern when one of these things happens:
- Impressions climb while CTR keeps dropping.
- CTR stays above baseline, but watch time or retention gets worse.
If both impressions and CTR look weak after 48 hours, it's a sign to update the thumbnail. The 48-hour rule is a simple guardrail: let the data settle before you act.
Why CTR should be checked alongside watch time and retention
High CTR only tells you the thumbnail got the click. It doesn't tell you what happened next. If viewers leave fast, that's a thumbnail-content mismatch - a broken viewer contract.
A steep drop in retention during the first 30 seconds usually points to that mismatch. In that case, fix the opening so it delivers on the thumbnail promise within the first 15 seconds.
There are four patterns worth watching. If impressions are high but CTR is low, the thumbnail isn't pulling clicks and needs a redesign. If impressions are low but CTR is high, the packaging is working, but reach is limited, so improve the title and SEO. If CTR is high but average view duration is low, the thumbnail is overselling the video, so bring it back in line with the actual content. And if impressions, CTR, and average view duration are all high, the package is working - save that style and use it again.
How to improve thumbnail CTR through testing and iteration
When CTR stays low after launch, stop just watching the numbers and start running controlled thumbnail tests.
How to use thumbnail experiments and manual swaps
YouTube's native Test & Compare tool is the cleanest option for thumbnail testing. You can upload up to three variants for one video, and YouTube splits traffic across them at the same time. Then YouTube picks the thumbnail that earns the most watch time.
If you don't have access to Test & Compare yet, manual swaps can still do the job. They just take more discipline, better notes, and more time. Here's the difference at a glance:
| Method | Reliability | Best Use Case |
|---|---|---|
| YouTube Test & Compare | High (statistical significance) | New uploads and high-traffic videos |
| Manual Swaps | Moderate (requires manual logging) | Evergreen content with low daily traffic |
One small detail can wreck the test: image quality. Upload every variant at 1,280 x 720 or higher. If one file is low-res, YouTube can force the full test down to 480p.
What elements to test one at a time
The rule here is simple: change one thing at a time.
If you swap the background color and the facial expression in the same test, you won't know what caused the lift or drop. Was it the brighter background? The new face? You'd just be guessing.
A cleaner approach is to test one variable per round, like:
- Facial expression
- Color
- Text
- Layout
Timing matters too. A channel getting under 500 impressions per day needs at least 7 days of data. If you're getting 2,000 to 10,000 impressions per day, 3 to 5 days is usually enough.
Once you have a winner, write it down in a playbook. That way, the next test starts from something that already worked instead of from scratch.
How ThumbnailCreator fits a CTR testing workflow
ThumbnailCreator fits best at the start of the process, before anything goes live.
Use it to make test-ready variants fast. You can generate multiple options from one prompt, then swap faces, objects, or text so each version changes only one element. That makes testing cleaner and easier to read later.
The workflow is pretty straightforward: create three distinct variants in ThumbnailCreator during the pre-publish phase, upload those three versions to YouTube's Test & Compare, then wait for YouTube to pick the winner. After that, save the winning design style to your playbook and use it as the baseline for the next round.
Log each winner in that playbook and build from there.
Conclusion: How to use CTR tracking without misreading the data
Compare CTR only within the same traffic source. That keeps the number easier to read and helps you avoid overreacting when traffic mix shifts.
The other metric that gives CTR context is Average View Duration (AVD). If CTR is high but retention is low, that usually points to a mismatch. People clicked, but the video didn’t line up with what the title or thumbnail seemed to promise.
CTR becomes much more useful when you pair it with source, retention, and enough data. Give new videos time to gather a solid number of impressions before you judge how they’re doing.
When you test changes, adjust one element at a time. That way, you can see what actually moved the needle.
Read CTR as a signal, not a verdict.
FAQs
Why is my CTR high but views still low?
A high CTR with low views usually means your video is getting shown to a small, loyal audience instead of a large one. In plain English: your thumbnail is doing its job, but that alone may not be enough to get more recommendations.
If view duration or retention is low, YouTube may stop showing the video to more people. ThumbnailCreator can help you make clear, accurate thumbnails that match your content more closely.
Should I change a thumbnail after the first day?
No. Wait at least 2 to 3 days after publishing before you test anything. That early traffic often comes from loyal subscribers, and it can skew the data.
Once the test begins, let it run for 7 to 14 days. Also wait until each variant gets 1,000 to 2,000 impressions before you make a call.
One more thing: if you change the thumbnail manually while a test is live, the experiment will end.
Which metric matters most with thumbnail CTR?
CTR matters because it shows a thumbnail’s first impression. If people see it and click, that’s a good start.
But CTR isn’t the whole story.
YouTube also looks at watch time share, which ties clicks to how long people keep watching. That means a thumbnail can win the click but still fall flat if viewers leave too soon.
That’s why a high CTR with low retention can hurt performance. A thumbnail might spark curiosity, but if the video doesn’t match that promise, people bounce.
So when you review results, look at CTR and average view duration side by side. That gives you a clearer read on whether your thumbnail is doing its job and whether it lines up with the content people actually get.