
5 Metrics for Evaluating Thumbnail Success
A thumbnail is only doing its job if it gets clicks and brings in viewers who keep watching. I’d track five numbers in YouTube Studio: CTR, impressions, views from Browse and Suggested, average view duration, and first-30-second retention.
Here’s the short version:
- CTR shows if people click.
- Impressions show if YouTube is showing the thumbnail enough.
- Browse and Suggested views show how it performs on recommendation surfaces.
- Average view duration shows if the click was a good fit.
- First-30-second retention shows if the video delivers on the thumbnail’s promise right away.
A fast rule I’d use: if a thumbnail gets a high CTR but retention drops hard in the first 30 seconds, it likely sets the wrong expectation. And if impressions are high but CTR is low, the packaging needs work.
5 YouTube Thumbnail Metrics: What They Mean & Warning Signs
Double Your YouTube Clickthrough Rate - An Evidence Based Thumbnail Formula
sbb-itb-b59debf
Quick Comparison
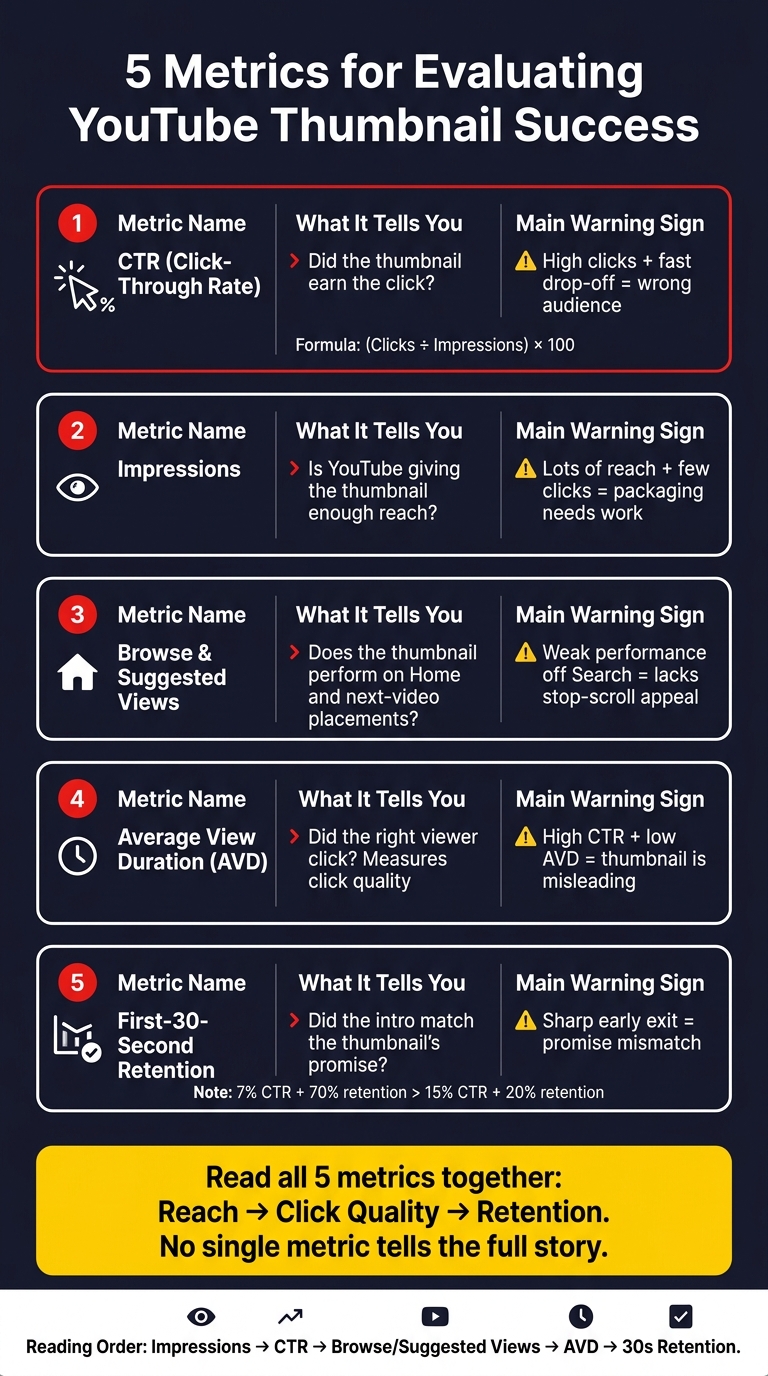
| Metric | What it tells me | Main warning sign |
|---|---|---|
| CTR | Did the thumbnail earn the click? | High clicks, fast drop-off |
| Impressions | Is YouTube giving it reach? | Lots of reach, few clicks |
| Browse/Suggested Views | Does it work on Home and next-video placements? | Weak performance off Search |
| Average View Duration | Did the right viewer click? | High CTR, low watch time |
| 30-Second Retention | Did the intro match the promise? | Sharp early exit |
If I want a clean read on thumbnail performance, I wouldn’t look at one metric alone. I’d compare these five numbers together to see reach, click quality, and viewer follow-through. This holistic view is essential for advanced thumbnail optimization.
What Thumbnail Success Looks Like on YouTube
A good thumbnail gets clicks from the right viewers. That part matters more than people think. If only one metric looks good, but the rest fall apart, the thumbnail isn’t doing its job.
CTR matters only if it turns into watch time. Your thumbnail sets an expectation at a glance. It tells viewers, “Here’s what you’re about to get.” If the video doesn’t match that promise, people bounce fast, and YouTube picks up on it. A retention drop of 40% or more within the first 30 seconds is a strong sign that the thumbnail and the video aren’t lined up.
The best way to read performance is from top to bottom: click quality, reach, then retention. That gives you a clearer read on whether the thumbnail is bringing in the right audience.
| Metric Pattern | Diagnosis | Action |
|---|---|---|
| High CTR / Low early retention | Thumbnail overpromises (clickbait) | Align thumbnail with actual content |
| Low impressions / High CTR | Strong thumbnail, limited distribution | Test a clearer thumbnail for broader reach |
| Low CTR / Strong retention | Content is better than its packaging | Redesign the thumbnail for broader appeal |
| High impressions / High CTR / High retention | Best result | Replicate this visual style going forward |
Think of it this way: a thumbnail shouldn’t just win the click. It should set up the kind of click that leads to people sticking around. That’s the difference between surface-level performance and a thumbnail that helps the video grow.
Where to Find These Metrics in YouTube Analytics
Once you know which metrics matter, the next step is finding them in YouTube Studio. These five metrics live across the Reach and Engagement tabs. Reach shows whether the thumbnail got the click. Engagement shows whether the video kept people watching.
In YouTube Studio, go to Content, pick a video, and open Analytics > Reach for Impressions, CTR, and the Impressions and how they led to watch time report. Those reports show if the thumbnail got the click and if the video kept the viewer watching. Then break the data out by traffic source, because the same thumbnail can work one way in Search and another way in Browse Features or Suggested Videos.
In Reach, open traffic source types and compare Search, Browse Features, and Suggested Videos. Those sources show how the same thumbnail performs in different placements. CTR shifts by source, so a blended average can hide what's going on.
CTR changes by traffic source, so review Search, Browse Features, and Suggested Videos on their own.
With the dashboard set, review each metric one by one.
1. Click-Through Rate (CTR)
CTR shows the share of people who saw your thumbnail and clicked. The formula is simple: (clicks ÷ impressions) × 100.
This is the clearest way to judge thumbnail performance. CTR tells you if the thumbnail wins the click. Impressions tell you how often YouTube put it in front of people.
Use CTR as a fast gut check on packaging strength, but don’t judge it in a vacuum. Traffic source matters.
In YouTube Studio, go to Analytics > Reach > Impressions click-through rate. Then filter by traffic source. Look at Search, Browse, and Suggested on their own, because each one has its own CTR baseline. Search tends to reward relevance. Browse and Suggested tend to reward packaging.
But CTR alone doesn’t tell the whole story. If people click and then leave in the first 30 seconds, YouTube may read that as a mismatch between the thumbnail and the video, which can send a negative signal. So yes, a high CTR is good. It only means something, though, if viewers stick around.
2. Impressions
Impressions count each time YouTube shows your thumbnail for at least 1 second, with at least 50% of it visible. In plain English, this tells you how much reach your thumbnail is getting. On its own, that number only tells part of the story. Read it next to CTR so you can tell whether the thumbnail is getting enough exposure to make a difference.
Impressions are the first reach signal. Even a great thumbnail won't help a video grow if YouTube isn't putting it in front of enough people. If impressions stay low, your reach stays capped, even when CTR looks strong.
CTR and impressions don't always move together. As a video starts reaching new groups of viewers, one can go up while the other drops. That's often normal.
Low impressions paired with high CTR usually point to limited reach. That can happen when the topic is too niche, the title is too narrow, or discovery signals aren't giving YouTube enough to work with when it tries to find a larger audience.
Here’s how the common impressions/CTR patterns usually play out:
| Pattern | Diagnosis | Action |
|---|---|---|
| High Impressions, Low CTR | YouTube is showing the video, but the thumbnail is not getting clicks | Redesign the thumbnail using data-driven thumbnail guides |
| Low Impressions, High CTR | The thumbnail is getting clicks, but reach is limited | Broaden the topic or tighten discovery signals |
| High Impressions, High CTR | Packaging and distribution are both working | Document and repeat the style |
| Low Impressions, Low CTR | YouTube tested the video, but viewers didn't respond | Rework the packaging and rethink the topic |
In YouTube Studio, compare impressions by traffic source to see where reach is coming from. Look at Search, Browse, and Suggested. That breakdown can show whether one source is doing most of the heavy lifting.
3. Views From Browse Features and Suggested Videos
After CTR and impressions, look at where those views came from. Browse and Suggested don’t work like Search, so it helps to review them on their own. Views from Browse Features and Suggested Videos show how your thumbnail performs on YouTube’s recommendation surfaces, not in Search.
Browse Features includes Home, Subscriptions, and Watch Later. People here usually aren’t hunting for one exact video. They’re scrolling. So if your thumbnail does well in Browse, it has strong stop-the-scroll appeal. Suggested Videos includes Up Next and end-of-video placements. These viewers are already watching something, but your thumbnail still has to feel like the right next click. That gap in viewer intent is why these traffic sources should be reviewed separately.
Browse CTR is usually lower than Suggested CTR, so judge each source against its own baseline.
In Advanced Mode, filter Browse Features and Suggested Videos separately. If Browse CTR is below your channel average, the thumbnail may need stronger contrast or a clearer focal point. If Suggested CTR is low, the thumbnail may not line up with the videos around it.
Then read those source splits alongside watch time and retention. A thumbnail can win the click and still bring in the wrong viewer, and that’s where these metrics help tell the full story.
4. Average View Duration
Average View Duration (AVD) tells you if people stuck around after your thumbnail got the click. It sits between the click and the retention curve.
Put simply, AVD helps you judge click quality. Not just did people click? but were they the right people to click? AVD shows whether the click turned into real watch time.
If viewers click and leave fast, the thumbnail likely promised something the video didn’t deliver. To judge AVD the right way, compare it against your channel average and the length of the video based on your thumbnail strategy.
The clearest warning sign is high CTR paired with low AVD. That usually means the thumbnail pulled people in, but the video didn’t match the promise. Low AVD points to a weak fit between the thumbnail and the content, and that can limit more distribution.
Use this table to read CTR and AVD together:
| CTR | AVD | What It Means | What to Do |
|---|---|---|---|
| High | High | Thumbnail attracts the right audience | Replicate this style |
| High | Low | Thumbnail is misleading or "clickbaity" | Re-align visuals with actual content |
| Low | High | Good content, weak thumbnail design | Improve contrast, faces, or text clarity using free thumbnail tools |
| Low | Low | Both content and thumbnail are missing the mark | Re-evaluate the topic or value proposition |
If AVD is weak, check the first 30 seconds retention graph to spot where viewers start dropping off.
5. Audience Retention in the First 30 Seconds
AVD tells you how long people stick around overall. First-30-second retention tells you something more specific: did they make it past the intro?
Those first few seconds act like a promise check. A viewer clicks because the thumbnail sets an expectation. Then, almost right away, they decide whether the video gives them what they came for. That makes this metric a simple way to see if your opening matches the promise in the thumbnail.
Here’s where it gets interesting: high CTR doesn’t always mean the thumbnail is doing its job well. If CTR is high but retention drops hard in the first 30 seconds, the thumbnail likely promised more than the intro delivered. A thumbnail with a 7% CTR and 70% retention is more useful to the algorithm than one with a 15% CTR and 20% retention. YouTube tracks early exits, and if people keep leaving fast, that can hurt future distribution.
Before you scrap a thumbnail or start redesigning your thumbnails, do a quick promise test. Write the thumbnail’s promise in one sentence. Then watch the first 30 seconds and ask a simple question: does the video pay that off right away? If the answer is no, the issue may be the intro, not the thumbnail. In that case, tighten the opening instead of throwing out packaging that may already be doing its job.
The key is to read CTR and first-30-second retention together. That’s how you tell the difference between a packaging problem and a follow-through problem.
| CTR Signal | 30s Retention Signal | Diagnosis | Recommended Action |
|---|---|---|---|
| High | High | Perfect alignment | Keep the packaging; study it for future videos |
| High | Low | Promise mismatch | Fix the video intro or make the thumbnail more accurate |
| Low | High | Weak packaging | Content is solid, but the thumbnail lacks visual pull |
| Low | Low | Thumbnail and intro both miss | Re-evaluate both the concept and the packaging |
How to Read These Metrics Together
Read these five metrics as a sequence: reach, click quality, then retention. That order matters. Impressions and CTR tell you if the thumbnail gets attention. AVD and early retention tell you if the video lives up to that first click.
A high CTR doesn't mean much if viewers bail right away. If CTR looks strong but AVD and first-30-second retention are weak, the thumbnail may be pulling in the wrong people or promising more than the video delivers.
If CTR drops while impressions go up, YouTube is often testing the video with a broader audience. Before you swap the thumbnail, look at the traffic-source mix.
The main thing to figure out is simple: did the thumbnail bring in the right viewer?
Once you spot the pattern, you can decide what to change. This is where thumbnail A/B testing helps you validate those changes with data.
How to Improve Thumbnail Performance After Reviewing the Data
Once you spot the weakest metric, make one thumbnail change and test again. That’s the key. Don’t change five things at once and hope for the best. Pick the weak spot, adjust for that issue, then check the same video again.
If impressions are high but CTR is low, the thumbnail isn’t winning the click. This often stems from common thumbnail mistakes that kill CTR. In Browse Features, that usually means the image needs more stop-power: stronger contrast, a bigger main subject, or a cleaner focal point. In Search, the fix is often simpler. Make the visual clearer so the subject lines up with what the viewer typed.
If CTR is strong but audience retention drops in the first 30 seconds, the thumbnail is bringing in the wrong audience. In plain English: people clicked, but the video didn’t match what they expected. Make sure the thumbnail reflects what the video actually delivers. A curiosity gap vs direct value strategy can work, but only if the video answers the question the thumbnail sets up.
If text is the issue, keep it to 3–5 words. Shorter text is easier to read on mobile.
If Browse CTR stays below 2% after 48–72 hours, swap the thumbnail and test again. Use ThumbnailCreator to make fast variations, and test one element at a time so you can see what changed CTR. Then retest before you touch anything else.
Conclusion
No single metric tells the full story. You need to track these five metrics as one system. When you look at them together, you get a much clearer read on whether your packaging lines up with viewer intent.
Taken as a group, these metrics show whether the thumbnail wins the click and holds attention. That means looking at the full click-to-retention path, starting the moment the thumbnail shows up in Search, Browse Features, and Suggested Videos. That’s the goal: bring in the right viewer, not just more viewers.
When you judge thumbnail success, retention matters more than vanity CTR. That’s the lens to use when you test new versions based on current thumbnail trends. Use ThumbnailCreator to create and refine thumbnail variations fast, then keep building on the visual styles and thumbnail strategies from successful creators that connect best with your audience. Treat thumbnails as a measurable system, not just something you make at the end.
FAQs
What is a good CTR for YouTube thumbnails?
A good click-through rate (CTR) usually falls between 4% and 10%.
Here’s a simple way to think about it:
- 2% to 5% is often average
- 4% to 6% is common across many channels
- 7% to 9% is good
- Above 10% is excellent
But numbers don’t tell the whole story. Context matters. Search results often get higher CTRs, usually around 8% to 15%. Homepage browse features tend to land lower, often in the 3.5% to 4.5% range.
That’s why it helps to look at CTR next to watch time. A high CTR can look great at first glance, but if people click and leave fast, your thumbnail may be pulling in the wrong viewers.
How long should I wait before changing a thumbnail?
It depends on how you’re testing.
With YouTube’s native Test & Compare tool, tests usually run 3 to 14 days. In most cases, it’s best to wait until YouTube declares a winner or each variant reaches at least 10,000 impressions.
If you’re running a manual test, don’t call it too early. A good target is about 1,000 to 5,000 impressions per thumbnail before you make a decision.
Should I fix the thumbnail or video intro first?
Check your metrics first.
If CTR is low but average view duration is decent, fix the thumbnail first.
If both CTR and average view duration are low, the content may be the problem.
If CTR is high but retention is low, the thumbnail may be misleading. In that case, make sure it lines up better with the video’s content or intro.