
How AI Predicts Thumbnail Trends
AI has transformed thumbnail design by making it a data-driven process. Instead of relying on trial and error, machine learning models analyze millions of thumbnails to identify patterns that increase click-through rates (CTR). Key insights include:
- Thumbnails drive over 50% of clicks on platforms like YouTube and TikTok.
- AI-generated thumbnails boost CTR by 30% on average compared to traditional designs.
- Popular trends include larger faces, bold colors, and concise text. For example, "surprised" or "happy" facial expressions appear in over 50% of top-performing thumbnails.
AI tools predict success by analyzing factors like color saturation, facial expressions, and text placement. They even score thumbnails before publication, saving creators time and effort. Post-launch feedback further refines these predictions, ensuring thumbnails align with viewer preferences.
For creators, leveraging AI tools like ThumbnailCreator simplifies this process. By using AI-generated templates, testing variations, and monitoring CTR benchmarks and watch time, you can design thumbnails that resonate with audiences and improve video performance.
How to Use AI to Make Thumbnails That ACTUALLY Work!
sbb-itb-b59debf
How Machine Learning Predicts Thumbnail Trends
Machine learning has transformed thumbnail design into a precise, data-driven process. Instead of relying solely on creative instincts, AI models analyze millions of high-performing thumbnails to pinpoint the visual elements that drive clicks. These algorithms assess factors like color saturation, facial expressions, text placement, and emotional appeal, building predictive models that estimate a thumbnail's success even before a video is published.
In the past, thumbnail selection was often based on subjective judgment after publication. Now, AI compares new designs to historical data, predicting performance pre-publication and allowing for targeted testing and refinement. Let’s break down the models that make this possible.
Machine Learning Models Used for Analysis
Several machine learning models come together to analyze thumbnail performance. At the core are Deep Neural Networks (DNNs), which classify thumbnails as high or low quality. Back in October 2015, YouTube’s Video Content Analysis team, led by Weilong Yang and Min-hsuan Tsai, launched a DNN-powered "thumbnailer" based on the Inception network architecture (GoogLeNet). This system was trained using custom thumbnails as positive examples and random video frames as negative examples. In side-by-side comparisons, human raters preferred AI-selected thumbnails over 65% of the time.
Other models, like Random Forest, Gradient Boosted Regressors, and SVM, analyze numerical and visual features such as brightness, saturation, contrast, and metadata to predict metrics like engagement and click-through rates. Advanced tools like CLIP (Contrastive Language-Image Pre-Training) ensure thumbnails align with video titles. For example, in September 2024, Storyblocks’ Data Science team, led by Greg Swanson, implemented a system combining CLIP for relevance, an aesthetic model for visual appeal, and a Feed-Forward Neural Network to predict download rates. This approach significantly boosted user engagement by replacing default frames with action-packed shots - like a car crash instead of a static image of a car.
Clustering techniques, such as t-SNE (t-distributed Stochastic Neighbor Embedding), also contribute by grouping similar thumbnail designs and identifying trending patterns like "The Shocked Face" or "The Fat Red Arrow". These tools empower creators to predict click-through performance with impressive accuracy, making AI an essential tool for AI thumbnail generation.
Data Sources and Features AI Examines
AI breaks down thumbnails into their essential components, using a combination of data sources and visual analysis. By tapping into the YouTube API, models gather information on view counts, historical click-through rates, and z-scored performance (how a video compares to a channel’s average).
On the visual side, algorithms analyze low-level image features like brightness, color saturation, hue, contrast, and edge scores. They also calculate the "unique RGB ratio", which measures the diversity of colors in an image relative to its total pixels. Compositional elements like text placement, word count, logo positioning, and graphic elements (e.g., before/after split screens) are also scrutinized.
Facial recognition models, such as DeepFace, identify the number of faces, their size in the frame, and emotional expressions. In September 2024, Kapwing conducted a study using Amazon Rekognition to analyze thumbnails from creators like MrBeast, Mark Rober, and SSSniperWolf. The study revealed that "surprised" expressions appeared in 26.95% of top thumbnails, while "happy" expressions appeared in 26.65%. SSSniperWolf used "surprised" expressions in 70% of her thumbnails, whereas Mark Rober featured "happy" expressions in 57.14% of his.
"Advanced machine learning algorithms can now decode complex visual patterns that humans might miss, analyzing thousands of thumbnail variations to identify precise combinations that maximize click-through rates." - Viewsmachine
The 4-Step AI Prediction Process
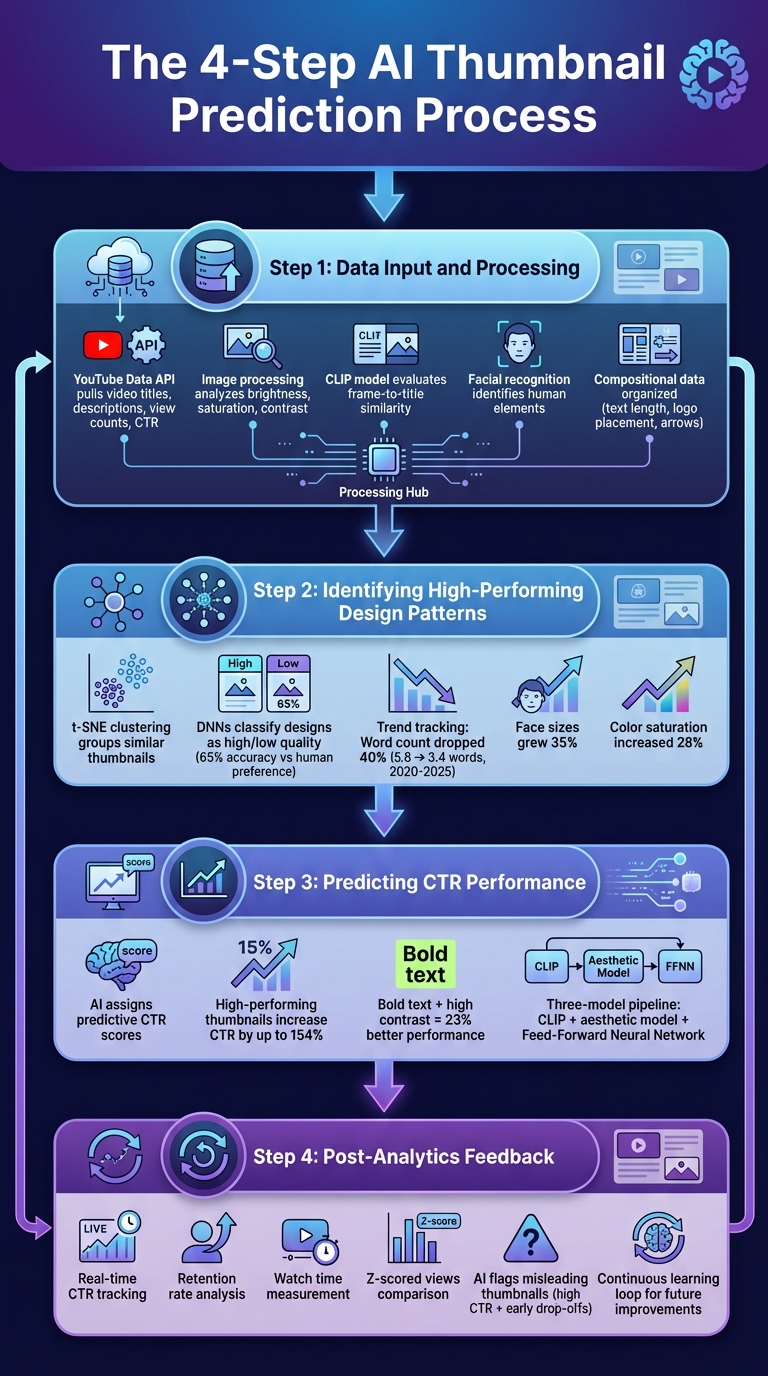
4-Step AI Thumbnail Prediction Process: From Data Input to Performance Optimization
AI doesn’t rely on guesswork when it comes to predicting thumbnail success - it follows a detailed, step-by-step approach to analyze data, make predictions, and refine its recommendations. By breaking down this process, creators can better understand how machine learning turns raw data into practical insights for thumbnail optimization. Here’s how it works:
Step 1: Data Input and Processing
The process kicks off with AI gathering data from various sources. Using the YouTube Data API (v3), it pulls information like video titles, descriptions, view counts, and historical click-through rates. Meanwhile, free thumbnail tools analyze visual details such as brightness, saturation, and contrast.
For uploaded videos, AI extracts frames at intervals, creating a pool of potential thumbnails. Then, a model called CLIP evaluates the similarity between these frames and the video title, ensuring the chosen thumbnail accurately reflects the content. This prevents using eye-catching but misleading images that might boost initial clicks but hurt viewer trust in the long run.
Facial recognition tools identify human elements, while compositional data - like text length, logo placement, and directional cues (e.g., arrows or “Before/After” layouts) - is organized into structured datasets. Once processed, the system clusters similar designs to identify patterns linked to strong performance.
Step 2: Identifying High-Performing Design Patterns
AI uses clustering techniques like t-SNE to group similar thumbnails and uncover recurring design trends that lead to better engagement. For example, elements like exaggerated facial expressions, bold colors, and minimal text often correlate with higher interaction rates.
Deep Neural Networks (DNNs), trained on millions of thumbnails, classify designs as high or low quality. These models use successful custom thumbnails as positive examples and random video frames as negative ones. In fact, earlier DNN thumbnailers showed a preference for human-chosen designs over 65% of the time.
The system also tracks how trends evolve. Between 2020 and 2025, average word counts on thumbnails dropped by 40% (from 5.8 to 3.4 words), while face sizes grew by 35%. During the same period, color saturation increased by 28%. By keeping up with these changes, AI ensures its recommendations reflect current viewer preferences.
Step 3: Predicting CTR Performance
Once high-performing patterns are identified, AI assigns predictive click-through rate (CTR) scores to thumbnail candidates. Statistical models analyze the features extracted earlier to estimate how a thumbnail might perform compared to others in the same niche.
In September 2024, Storyblocks’ Data Science team, led by ML Engineer Greg Swanson, introduced a three-model pipeline combining CLIP for relevance, an aesthetic appeal model, and a custom Feed-Forward Neural Network to predict download rates. This system swapped out default first-frame thumbnails for action shots (e.g., a car crash instead of a pre-crash scene), significantly boosting engagement.
Research shows that high-performing thumbnails can increase CTR by up to 154%. Thumbnails with bold text and high contrast perform 23% better than lower-contrast designs. AI uses these insights to score new thumbnails and highlight elements likely to generate clicks in specific content categories. After scoring, the system refines its predictions using post-launch data in the next step.
Step 4: Post-Analytics Feedback
AI doesn’t stop once a thumbnail is published. It monitors real-time engagement metrics like CTR, retention rate, watch time, and z-scored views to fine-tune its accuracy. This feedback loop helps the system learn from both successes and mistakes.
For instance, if a thumbnail has a high CTR but causes early drop-offs, AI flags it as potentially misleading. Over time, the system balances curiosity-driven designs with authenticity to protect long-term channel success. Creators who regularly review performance metrics can identify which visual elements consistently work and feed this knowledge back into the AI, improving future predictions.
"A strong, vibrant, and relevant thumbnail draws attention, giving viewers a quick preview of the content of the video, and helps them to find content more easily. Better thumbnails lead to more clicks and views for video creators".
Using AI Predictions with ThumbnailCreator
ThumbnailCreator makes it easy to turn predictive data into actionable design tools. By analyzing trends and leveraging AI insights, the platform helps you create thumbnails that align with what’s currently resonating with audiences. It bridges the gap between analytics and design, giving you the tools to craft thumbnails that stand out.
Creating Thumbnails with AI-Generated Templates
ThumbnailCreator’s AI-powered templates are built on data from millions of successful thumbnails, offering you designs that are ready to grab attention instantly. These templates reflect proven trends, such as larger faces (which boost engagement by 35%), enhanced color saturation (up 28%), and concise text that matches current design styles.
The "Recreate" feature takes this a step further by letting you reverse-engineer thumbnails from top-performing competitors. It analyzes elements like layout, colors, and composition to help you create variations that fit your brand while emulating successful designs. For example, if a gaming channel is trending with split-screen "before/after" thumbnails, you can input one of their designs and generate similar styles tailored to your content. This eliminates guesswork, ensuring your thumbnails align with what’s working in your niche.
Enhancing Thumbnails with Advanced Features
Once you’ve picked a template, ThumbnailCreator offers advanced tools to refine your design based on AI predictions. These tools ensure every detail aligns with high-performing design patterns:
- Face swapping: This feature lets you insert high-quality, expressive faces into thumbnail scenes, keeping your branding consistent. With exaggerated expressions like surprise or anger - popularly known as the "YouTube Face" - you can experiment with different emotional cues without needing to reshoot photos.
- Text editing tools: Align your text with current trends, such as bold, high-contrast designs that outperform lower-contrast options by 23%. The platform guides you on word count and placement for maximum impact.
- Object swapping: Add elements like arrows or emphasize specific subjects to draw viewers’ attention. These directional cues are proven to spark curiosity and improve engagement.
For creators focusing on mobile audiences - especially since 70% of YouTube traffic comes from mobile devices - ThumbnailCreator includes a preview mode. This ensures your thumbnails are readable and effective even on small screens.
Testing and Iterating for Better Results
ThumbnailCreator also helps you fine-tune your designs through testing. You can compare thumbnail variations and strategies, tweaking one element at a time - like face size or background color - to see what improves click-through rates.
Some creators use the "Shorts First" method, where they test three thumbnail concepts as covers for YouTube Shorts. The version with the highest retention becomes the thumbnail for their long-form video.
It’s important to remember that YouTube’s 2026 algorithm focuses on satisfaction-weighted discovery. This means thumbnails that may have slightly lower CTRs but lead to higher watch times tend to perform better in the long run. Once you find a winning design, use it as your baseline and continue testing small tweaks. Over time, these incremental improvements can lead to noticeable growth in performance.
Measuring Success and Improving Predictions
Once you've fine-tuned your design elements, the next step is to measure how well they perform and use that data to improve future predictions. Creating thumbnails based on AI predictions is just the starting point. The real value lies in tracking their performance and using that feedback to refine your designs. This process helps you make informed adjustments and create more effective thumbnails over time.
Tracking Key Performance Metrics
One of the most important metrics to monitor is Click-Through Rate (CTR). This measures the percentage of viewers who click on your thumbnail after seeing it. On YouTube, a CTR of 4–5% is considered average, 6–10% is strong, and anything above 10% suggests your thumbnail might go viral.
Another key metric is Average View Duration (AVD), which tells you if your thumbnail is attracting engaged viewers or just driving clicks. A high CTR with a low AVD could mean your thumbnail is misleading. Ideally, aim for viewers to watch at least 50% of your video - this indicates your thumbnail accurately represents your content. In some cases, a thumbnail with slightly lower CTR but higher viewer retention can outperform others in the long run.
You should also pay attention to Watch Time Share, a YouTube metric that reflects engagement beyond clicks. Other useful metrics include impressions, which show how often your thumbnail is being seen, as well as bounce rate, likes, comments, and shares. Together, these metrics paint a clearer picture of how viewers respond to your content.
By analyzing these metrics, you can make adjustments to improve both your thumbnail designs and the AI predictions behind them.
Refining AI Predictions with Feedback Loops
Metrics like CTR and AVD don’t just measure success - they also help refine AI predictions. Using r-squared accuracy measures, you can improve how well the AI aligns with viewer behavior.
To make this process easier, maintain a testing log to track what works. For example, you might notice that thumbnails with a blue background consistently outperform those with red, or that bold facial expressions get more clicks than neutral ones. These observations help you refine AI prompts and parameters for future designs. Running monthly audits of your top-performing thumbnails can also uncover patterns that guide your long-term strategy.
A/B testing is another essential tool for validating AI predictions. YouTube’s "Test & Compare" feature allows you to test up to three thumbnail variations. For reliable results, you’ll need at least two weeks and thousands of impressions to reach statistical significance. When testing, focus on changing one major element at a time - like adding a face versus no face, or bold text versus minimal text - so you can pinpoint exactly what makes a difference. Once you find a winning design, use it as your new baseline and test another AI-predicted variation against it. This iterative process ensures you’re always building on your successes.
Conclusion
AI has reshaped the way creators design thumbnails, turning what was once a process of trial and error into a data-driven strategy. By examining visual trends, color schemes, and emotional triggers, machine learning models can predict click-through rates even before a video is published. This means creators are no longer relying on guesswork - they're designing thumbnails based on solid predictions about what resonates with viewers, from facial expressions to color choices and layout.
These tools not only inform design choices but also help creators refine their strategies over time. AI-generated thumbnails are tailored to boost click-through rates and are optimized for mobile viewing, offering creators a clear performance advantage.
The real power of AI lies in its ability to identify and replicate successful design patterns far more efficiently than manual methods. For creators who embrace AI-driven insights, the result is a noticeable edge in a highly competitive space, with continuous improvement being the key to staying ahead.
FAQs
How does AI score a thumbnail before I publish?
AI reviews thumbnails by examining essential visual components such as color contrast, facial expressions, text positioning, and emotional cues. This process helps estimate how likely a thumbnail is to attract clicks (CTR) and grab attention, giving creators insights to tweak and improve engagement.
Which thumbnail features matter most for CTR?
If you're aiming to boost your click-through rate (CTR), pay attention to these essential thumbnail elements:
- High-contrast colors: Bold color combinations can make your thumbnails stand out in a crowded feed.
- Expressive faces: Thumbnails featuring clear, larger faces with strong emotions tend to connect better with viewers.
- Bold text: Keep text short - ideally under 12 characters - to ensure it's easy to read at a glance.
Recent trends show that larger, more prominent faces and increased color saturation are becoming go-to strategies for grabbing attention. These tweaks can make your thumbnails more eye-catching and, ultimately, more clickable.
How do I A/B test thumbnails the right way?
To test thumbnails effectively on YouTube, take advantage of the "Test & Compare" feature. This tool lets you rotate up to three thumbnail variations and collect performance data. Make sure each variant stands out with noticeable differences - think changes in colors, text, or overall design. Run your tests for a minimum of two weeks or until you've gathered enough impressions for meaningful insights. Pay close attention to metrics like click-through rate (CTR) and watch time. Use the results to refine your approach and create thumbnails that drive stronger engagement.