
How Competitor Retention Affects Video Rankings
Want your YouTube videos to perform better? Focus on audience retention. YouTube's algorithm prioritizes videos that keep viewers engaged over those with just high view counts. Here's why retention matters and how studying competitors can help:
- Audience Retention Basics: Tracks the percentage of your video viewers watch. High retention signals quality to YouTube.
- Relative Retention: Compares your video to similar content, impacting recommendations.
- Competitor Insights: Analyzing competitor retention reveals strategies to improve pacing, structure, and engagement.
- Retention Benchmarks: Shorter videos need higher retention; for example, 5-10 min videos perform well with 50-60% retention.
- Thumbnails' Role: Avoiding clickbait vs authentic thumbnails is crucial; misleading thumbnails hurt retention. Align your thumbnail with the video's content for better results.
Retention isn't just about keeping eyes on your video - it's the key to growing your channel and gaining more impressions. Let's dive into the details.
YouTube Strategy 2026: Why Viewer Retention Is the ONLY Metric That Matters
sbb-itb-b59debf
How Retention Affects YouTube Video Rankings
YouTube Video Retention Benchmarks by Video Length
Retention vs. Watch Time: What's the Difference?
Retention and watch time measure different aspects of how viewers engage with your content. Watch time is the total amount of time people spend watching your video, while retention looks at the percentage of your video that viewers actually watch. For example, if a 10-minute video has 80% retention, it means viewers typically watch 8 minutes of it. This is common in high-performing tutorial videos where viewers stay to learn a specific skill.
YouTube's algorithm treats these metrics differently. Watch time reflects how much attention your video generates overall, but retention shows how engaging or satisfying viewers find it. As Dataslayer highlighted in their 2025 YouTube Algorithm analysis:
A 6-minute video with 80% retention (4.8 minutes watched) typically outperforms a 20-minute video with 30% retention (6 minutes watched) because the higher percentage signals superior viewer satisfaction.
For YouTube Shorts thumbnails, retention percentage is the main ranking factor. For longer videos, both metrics matter, but retention acts as the primary quality filter, determining whether the algorithm will promote your content. This distinction is key to understanding how retention influences video performance.
How the Algorithm Uses Retention as a Quality Indicator
When a new video is uploaded, YouTube tests it with a small audience. If retention rates are high, the algorithm interprets this as a sign of viewer satisfaction and expands the video's reach to a larger audience. On the flip side, poor retention halts this process, limiting the video's visibility.
Retention often outweighs raw view counts in importance. For example, a video with 50% retention and 1,000 views is more likely to receive long-term promotion than one with 20% retention and 5,000 views. As of 2026, audience retention and viewer satisfaction surveys rank as "Very High" signals for the algorithm - more influential than metrics like likes or comments.
The algorithm also uses relative retention to compare your video's performance against others of similar length. A video with 45% absolute retention might achieve 150% relative retention if competing videos average only 30%. This comparison plays a big role in deciding which videos appear in search results and suggested feeds. Videos with an average view duration of 50% or higher are three times more likely to be recommended by the algorithm.
Retention Benchmarks and Their Impact on Rankings
Retention benchmarks vary depending on the length of the video. Shorter videos typically need higher completion rates to perform well, while longer videos can rank with lower percentages.
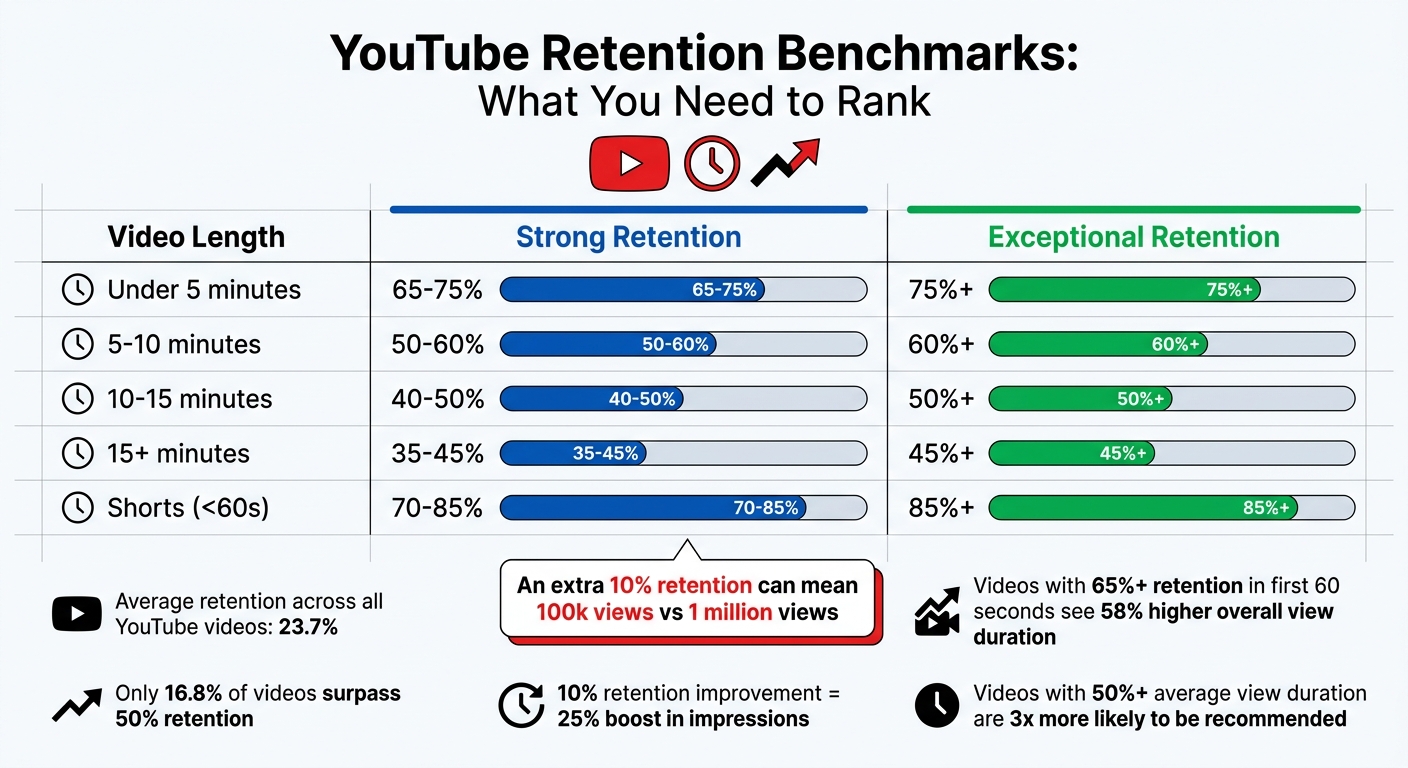
| Video Length | Strong Retention | Exceptional Retention |
|---|---|---|
| Under 5 minutes | 65-75% | 75%+ |
| 5-10 minutes | 50-60% | 60%+ |
| 10-15 minutes | 40-50% | 50%+ |
| 15+ minutes | 35-45% | 45%+ |
| Shorts (<60s) | 70-85% | 85%+ |
The average retention across all videos on YouTube is just 23.7%, and only 16.8% of videos surpass the 50% threshold. Hitting the "strong" benchmarks above puts your content ahead of most creators. In fact, channels that improve their retention by just 10 percentage points often see a 25% boost in impressions from the algorithm.
The first minute of your video is especially important. Videos that maintain 65% or higher retention in the first 60 seconds see 58% higher overall average view duration compared to those that drop below 50% in this critical window. YouTube strategist Paddy Galloway puts it this way:
An extra 10% audience retention can be the difference between a video getting 100k views or 1 million.
How to Analyze Competitor Retention Data
What Metrics You Can Track
Understanding competitor retention metrics can provide valuable insights to refine your own strategies. While platforms like YouTube don't share exact retention curves, you can still estimate performance using publicly available data. One of the most reliable indicators is the like-to-view ratio. A ratio exceeding 5% generally points to strong engagement and retention. For example, if a video has 100,000 views and 6,000 likes, the 6% ratio suggests that viewers were engaged enough to interact.
Another useful metric is comment timestamps, which reveal the moments that resonated most with viewers. By reviewing the top 20 comments and noting recurring timestamps, you can identify sections of a video that captured attention. If several viewers mention the same moment, it's a clear sign that part of the video stood out.
You should also monitor engagement velocity, which measures the rate of likes, comments, and shares within the first 24 to 48 hours after a video is uploaded. A high velocity often indicates strong initial interest and predicts better retention. Additionally, analyzing the progress bar of a video can help pinpoint segments that viewers frequently replay, signaling high value or compelling delivery.
Using analytics tools to evaluate tags, SEO scores, and audience drop-off patterns further enhances your understanding of what drives strong retention in competitor videos.
What Drives High Retention in Competitor Videos
Once you've tracked these metrics, it's time to dissect what makes competitor videos so engaging. Successful creators often rely on consistent visual pacing, incorporating techniques like frequent camera cuts, B-roll footage, and on-screen text every 5 to 8 seconds. This dynamic approach keeps viewers engaged and reduces the temptation to scroll away.
Another key tactic is delivering value right from the start. Instead of lengthy intros or animated logos, top creators dive straight into the content. YouTube creator Ali Abdaal shares his strategy:
I analyze every competitor's first 30 seconds frame by frame. That's where I learn the most about retention.
Creators also use micro-hooks to sustain interest throughout the video. These are small teasers or open loops introduced every 60 to 90 seconds, such as saying, "Stick around for the bonus tip at the end." This approach builds anticipation and discourages viewers from leaving early. Additionally, many creators strategically use pattern interrupts - unexpected changes in visuals or tone - around the 25% to 30% mark to re-engage their audience.
Paddy Galloway, a YouTube strategist, highlights the importance of learning from others:
Every video I make is influenced by studying what worked for others. But I always add my unique angle. That's the difference between learning and copying.
These tactics not only boost retention but also provide inspiration for improving elements like thumbnails. Tools such as ThumbnailCreator can help optimize designs to increase click-through rates and set your content apart.
How Thumbnails Affect Retention Rates
Why Thumbnails Matter for Retention
When it comes to keeping viewers engaged, thumbnails are more than just a decorative element - they’re critical. A thumbnail acts as a visual promise, setting expectations for what the video will deliver. If the video doesn’t match those expectations, viewers are quick to leave, which can hurt your retention rate.
YouTube’s algorithm favors videos with both high click-through rates (CTR) and strong watch times. Misleading thumbnails might grab attention initially, but the inevitable early drop-offs send negative signals to the algorithm, limiting the video’s reach. As TubeAI Learn puts it:
The thumbnail is a promise. Your content is the delivery. Both must align for the system to work in your favor.
The stats reinforce this. Ninety percent of top-performing videos use custom thumbnails, and well-designed thumbnails can increase CTR by an average of 154% compared to auto-generated ones. Videos with optimized thumbnails also capture 67% of their total engagement within the first 24 hours, compared to only 31% for poorly designed ones. This early engagement is crucial for YouTube to push your content to a broader audience.
With over 70% of YouTube views coming from mobile devices, mobile optimization is another key factor. Thumbnails that are too cluttered often fail on smaller screens, reducing CTR by 28%. High-contrast text overlays can improve performance by 43%, and thumbnails featuring expressive human faces see CTR increases of up to 67%. On the flip side, dark or low-contrast thumbnails perform poorly on mobile, decreasing CTR by 41%.
Creating Better Thumbnails with ThumbnailCreator
Designing effective thumbnails doesn’t have to be complicated. ThumbnailCreator, an AI-driven tool, makes it easy to create thumbnails that boost both clicks and viewer retention. It incorporates proven design elements like expressive faces, bold text, and vibrant colors, even for users with no design experience. Channels using optimized thumbnails through this platform often achieve CTRs of 8% or higher, compared to the 3.2% average for auto-generated thumbnails.
The tool offers features tailored to improve retention. For instance, face-swapping functionality allows creators to test different emotional expressions, as close-up, expressive faces can increase CTR by 67%. Text editing tools help ensure your copy stays within the ideal 3–5 word range while maintaining strong contrast. Additionally, object swapping and AI-generated variations make it easy to experiment with multiple designs and conduct A/B testing to improve performance.
ThumbnailCreator also helps avoid common mistakes that can hurt performance. Using generic stock photos can lower CTR by 52%, and cluttered designs can reduce it by 28%. Instead, the platform encourages focusing on a single, dominant focal point and using saturated colors that stand out against YouTube’s interface - an approach that can increase CTR by 34%. These strategies not only improve CTR but also contribute to better video retention, helping your content succeed in the competitive YouTube landscape.
Conclusion
Why Retention Matters for Channel Growth
Audience retention is a key factor in driving YouTube channel growth. The platform's algorithm heavily relies on retention as a predictor for recommending videos. Simply put, higher retention rates lead to broader distribution, while lower rates can limit your video's reach.
For example, a video with 10,000 views and a 60% retention rate is more likely to grow than one with 50,000 views but only a 25% retention rate. Even a modest improvement - just 10 percentage points in average retention - can result in over a 25% increase in impressions from YouTube's recommendation system. Creators who prioritize retention over sheer view counts often experience 3–5 times faster growth.
Analyzing your competitors' retention strategies can provide a clear path to improving your own content. By studying successful tactics in your niche, such as hooks and pacing, you can adapt proven methods to your videos. Creators who take the time to analyze their competition grow three times faster than those who don't.
These findings emphasize the importance of making strategic improvements, which are outlined in the steps below.
Action Steps for Creators
- Audit Competitors Monthly: Select five top-performing videos from your niche each month and study their first 30 seconds in detail. This "Hook Zone" is critical since 55% of viewers drop off within the first minute. Pay attention to how these creators deliver value immediately or spark curiosity that aligns with their thumbnail's promise.
- Analyze Retention Graphs: Use YouTube Studio's retention metrics, especially the Relative Retention graph, to see how your videos compare to similar content. Identify "cliff" points where you lose 4% or more of your audience in one moment. Adjust pacing at these drop-offs by incorporating pattern interrupts - like switching camera angles, adding B-roll, or inserting graphics every 20–30 seconds.
- Optimize Thumbnails: Ensure your thumbnails align with your video's promise. Tools like ThumbnailCreator can help you design thumbnails that not only attract clicks but also set accurate expectations. A high click-through rate is meaningless if viewers leave quickly because the content doesn't match the thumbnail. Matching expectations leads to better retention and improved performance in YouTube's algorithm.
FAQs
What retention metric should I prioritize first?
Focus on boosting audience retention before anything else. Why? Because it’s a key factor in how YouTube ranks and recommends videos. When viewers stick around, it tells YouTube your content is engaging. And the more engaging your content, the higher the chances it gets promoted to a wider audience.
How can I estimate another channel’s retention without their analytics?
Estimating audience retention without direct analytics can be challenging, but there are ways to get a sense of it using indirect methods. Start by looking at public engagement signals such as comments, likes, and shares - these can hint at how well content resonates with viewers. Additionally, YouTube’s public retention graphs can reveal where viewers tend to drop off during a video, offering clues about which parts keep their attention.
Another approach is to compare views and engagement metrics relative to the channel’s size and niche. For instance, a smaller channel with high engagement might indicate strong retention, while a larger channel with low interaction could suggest the opposite. While these methods won’t provide exact figures, they can help you form a reasonable estimate of audience retention using publicly available data and industry benchmarks.
How do I raise retention without using clickbait thumbnails?
To keep your audience engaged without resorting to clickbait thumbnails, prioritize the quality of your content and how you connect with viewers. Begin with a compelling hook in the first 10 seconds to grab attention right away. Maintain a steady, engaging pace throughout and introduce pattern interrupts - like a change in visuals or tone - every 30-45 seconds to keep things fresh.
Use retention graphs to track where viewers tend to drop off. These insights can help you identify and cut out slower, less engaging parts of your content. By fine-tuning your flow and keeping the energy up, you’ll naturally hold your audience’s attention for longer.