

How Thumbnails Impact Video Promotion
A thumbnail can decide the click before the title gets a chance. From the data in this article, thumbnails drive about 65% of the first click, and even a small CTR jump, like 4.0% to 5.5%, can lead to many more views from the same number of impressions.
If I had to boil the whole article down, it’s this:
- Thumbnails change CTR fast
- Big visual shifts beat tiny design tweaks
- CTR alone is not enough; watch time still matters
- Traffic source changes what “good” looks like
- Testing one variable at a time gives the cleanest read
The main patterns are simple. I’d focus first on:
- One clear face with a readable expression
- Short text: about 1–5 words
- Strong contrast so the subject stands out on mobile
- Simple backgrounds that don’t fight the focal point
- Big tests like color, expression, or text, not tiny spacing edits
A few numbers stand out:
- Healthy YouTube CTR often falls around 4%–6%
- Search traffic can hit 8%–15%
- Browse often sits around 3%–7%
- Background color changes can shift CTR by 18%–25%
- Face or expression changes can move CTR by 12%–18%
- Small layout edits often change CTR by less than 3%
What I like about this article is that it sticks to test results, not design taste. The takeaway is clear: if a thumbnail lifts clicks and the video keeps people watching, YouTube is more likely to show it to more people.
So if you want the short answer: better thumbnails can bring more views, but only when the click matches the video well enough to hold attention.
YouTube Thumbnail CTR Strategy
sbb-itb-b59debf
What Research Shows About Thumbnails and Click-Through Rate
YouTube Thumbnail CTR Benchmarks & Visual Element Impact
CTR benchmarks and what thumbnail changes can realistically move
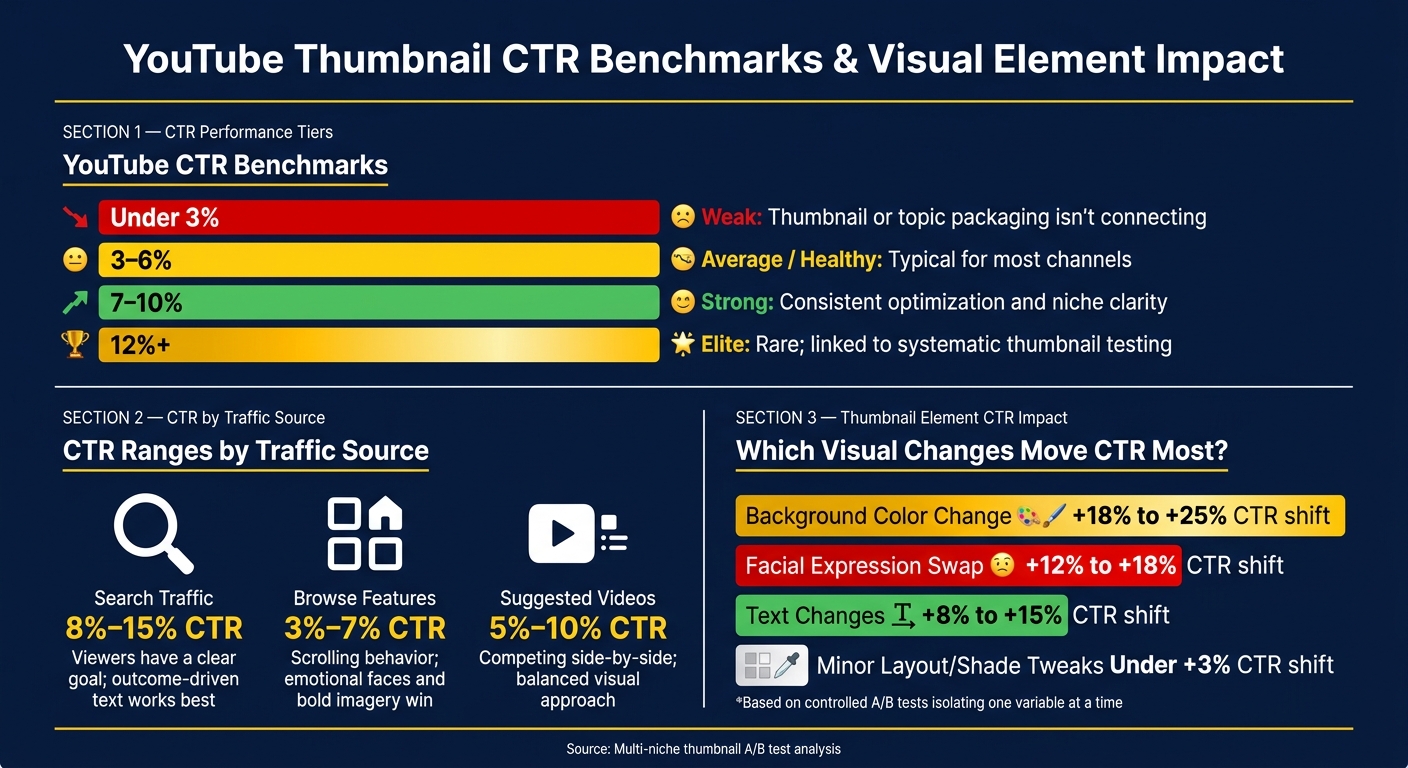
Most YouTube channels land somewhere between 2% and 10% CTR, with 4% to 6% sitting in the normal healthy range across the platform. Where a channel lands inside that range usually comes down to its size, niche, and traffic source.
Here’s a simple way to read those numbers:
| CTR Range | Performance Level | What It Suggests |
|---|---|---|
| Under 3% | Weak | Thumbnail or topic packaging isn't connecting |
| 3–6% | Average / Healthy | Typical for most channels |
| 7–10% | Strong | Consistent optimization and niche clarity |
| 12%+ | Elite | Rare; usually linked to thumbnail testing at scale |
What tends to push a channel into that 12%+ tier isn’t one big redesign. It’s repeated testing over time.
That part matters because the biggest CTR gains usually show up when a test isolates just one thumbnail variable. In those cases, broad visual changes tend to beat tiny edits. Background color produces the largest average CTR shift at 18% to 25%. Facial expression swaps come next at 12% to 18%. Text changes usually land in the 8% to 15% range. Minor layout or shade tweaks often move CTR by less than 3%.
In plain terms, swapping a small shadow or nudging an element a few pixels often won’t do much. Changing the overall visual signal can.
Controlled tests that isolate the thumbnail variable
The cleanest tests change only the thumbnail, split impressions evenly, and wait for at least 10,000 impressions before reading results.
That setup matters. If you change the title, topic framing, and thumbnail all at once, you can’t tell what did the work. A clean test gives you a cleaner read.
How results differ across search, browse, and suggested traffic
CTR changes a lot by traffic source, so one blended average can hide what’s going on.
Search traffic usually gets the highest CTR, often 8% to 15% for well-optimized content, because viewers come in with a clear goal. In that setting, thumbnails with short, high-contrast text that clearly signals the video’s outcome tend to work best.
Browse Features usually lands around 3% to 7%, since people are scrolling rather than hunting for one exact answer. Here, emotional faces and bold imagery often matter more than detailed text, and cluttered thumbnails can cut CTR compared with cleaner designs.
Suggested Videos tends to sit in the middle at about 5% to 10%, where viewers already have some topic interest but are still choosing among nearby options.
A quick breakdown:
- Search: 8% to 15%, with outcome-driven text often helping
- Browse Features: 3% to 7%, where clean visuals and emotional cues often matter more
- Suggested Videos: 5% to 10%, with thumbnails competing side by side
That means the same thumbnail edit can work in one source and flop in another. Adding a short text overlay, for example, can lift CTR in Search while doing little - or even hurting a bit - in Browse. Break out CTR by source in YouTube Studio. That source-level view shows which design choices are doing the heavy lifting.
Which Thumbnail Visual Elements Affect Attention and Clicks
Once you know your CTR benchmarks, the next step is pretty simple: figure out which thumbnail cues pull people in. Test data points to the same few patterns again and again - faces, short text, and strong contrast. Those details can move CTR and also affect how far YouTube pushes a video.
Faces, emotion, and focal subjects
Human faces show up again and again in thumbnail research. In one analysis of 1,000 thumbnails, face thumbnails averaged 6.8% CTR compared with 4.1% for thumbnails without faces. Another multi-niche study found that thumbnails with a single main face and a clear emotional expression beat neutral or no-face thumbnails by 18–32% CTR.
The practical takeaway is straightforward. Use one main face that fits the video’s topic. Direct eye contact tends to work well for personal, commentary, or reaction videos. For tutorials and product content, a face looking toward the subject often works better. And on mobile, size matters - the face needs to be big enough to read at a glance.
Text length, legibility, contrast, and background simplicity
Text works best when it’s short and easy to scan. Stick to 1–5 words, with 3–5 words as a strong target, and use bold, high-contrast type that can be read right away on a phone. You can create these elements using free thumbnail tools designed for high-impact design. In one analysis, high-contrast typography delivered about 27% better performance than lower-contrast options, and high-contrast text overall has been reported to lift CTR by up to 30%.
Contrast also matters beyond the text itself. Eye-tracking data shows that viewers lock onto the highest-contrast point in a thumbnail within 50 ms. In one sample, thumbnails with a foreground-to-background luminance ratio above 7:1 beat others by about 2.3x average CTR. A separate analysis found that high-contrast thumbnails got an average of 37% more impressions from the YouTube recommendation system. The same source reported that value contrast - the gap between light and dark areas - was 2.3x more effective at directing attention than hue contrast alone.
That’s why simple backgrounds help so much. If the background is busy, the subject has to fight for attention. If the background is clean, the viewer sees the point fast.
The three strongest patterns from the research are:
- Single dominant face + clear emotion: +18–32% CTR vs. neutral or no-face thumbnails in controlled A/B tests
- Short text (1–5 words) + high-contrast type: Up to +30% CTR improvement
- High-contrast thumbnails overall: +37% increase in impressions; value contrast 2.3x more attention-directing than hue contrast
Treat these as inputs to test, not rules carved in stone. Then watch what happens to early CTR and reach when a thumbnail wins. Those visual cues matter because they shape the early CTR signal that drives distribution.
How Thumbnails Affect Promotion Performance and Distribution
Early CTR signals and broader distribution
Once a thumbnail gets attention, the next step is simple: does that attention lead to more distribution? A thumbnail doesn't directly push promotion on its own. What it does is change how often impressions turn into clicks.
YouTube usually starts by testing a new video with a small early audience to set a CTR baseline. If early CTR is strong, the platform may expand distribution across Browse and Suggested. If it's weak, reach can slow down fast.
Traffic source changes how you should read those numbers. In search, average CTR is often higher, with some third-party estimates putting it around 12.5%. Suggested videos come in closer to 9.5%, while browse features average about 3.5%. So a 4% CTR might be fine for broad browse exposure, but it can look weak in search. That's why traffic source matters so much when deciding whether a thumbnail needs a redo.
How studies structure thumbnail tests in real campaigns
This is where test design makes or breaks the read. The cleanest thumbnail tests keep everything else the same. Leave the title, targeting, and budget alone. Then measure one thumbnail change by CTR and watch time across the first 7–14 days.
There's also an important catch here. YouTube's Test & Compare system picks winners based on engaged watch time, not raw CTR. In plain English, a thumbnail that gets the click but loses the viewer can drag performance down. Clicks matter, but engaged views matter more.
Research points to a simple rule for action, too. If CTR stays below 3–4% after the first 48 hours and about 1,000 impressions, the odds of a turnaround are slim, so testing a new thumbnail is often the better move than sitting tight.
When teams test thumbnail design choices, a few patterns show up again and again:
- Background color tends to drive some of the biggest CTR swings, often around 18% to 25%.
- Facial expressions can shift CTR by roughly 12% to 18%.
- Small layout changes usually move the needle far less, often by under 3%.
After that first test window, break results out by traffic source. A thumbnail can do one job in search and a different one in browse or suggested. That split often shows which design choices are pulling their weight and which ones just look good on paper.
Applying Research Findings With ThumbnailCreator and a Test-Measure Workflow
Using ThumbnailCreator's AI features to test research-backed thumbnail variables
Turn the research into a simple test plan. Start with the thumbnail variables that showed the biggest lift in measured results. Focus on the elements that moved CTR most in the studies: background brightness, facial expression, short text, and contrast. Use one clear subject, strong contrast, and a simple background so the promise is easy to read on mobile.
ThumbnailCreator helps you test those ideas without rebuilding the whole thumbnail from scratch. You can generate 2–4 variants around one variable at a time, whether that's expression, background, text, or object placement. That makes it much easier to test a clear hypothesis instead of changing five things at once and guessing what worked. Avoiding common thumbnail mistakes ensures your tests start from a strong baseline.
Keep the setup simple:
- Test 2–4 variants
- Change one major element at a time
- Let the data decide
After you generate your variants, lock the win rule before you publish. Set that rule in advance - for example, switch only if Variant B lifts CTR by 10% without hurting retention - and run the test for at least 48 hours.
Conclusion: What the evidence says creators should act on
Thumbnails have a clear effect on attention, CTR, and promotion efficiency. But that effect doesn't look the same everywhere. It changes based on traffic source, content niche, and what the audience expects. That's why you should segment results by traffic source instead of averaging everything together.
The safest path is a structured testing process. Isolate one major change at a time, then measure CTR alongside watch time from impressions and downstream retention. If CTR goes up but watch time drops, that thumbnail may be winning the click while losing the viewer.
| Research-Backed Attribute | ThumbnailCreator Feature | Primary Metric Influenced |
|---|---|---|
| Background color & brightness | AI generation / color filters | Click-through rate |
| Facial expressions & emotion | Face swapping / AI generation | Click-through rate |
| Short, specific text (3–5 words) | Text editing / font templates | Click-through rate |
| High contrast & focal clarity | Object swapping / background removal | Impressions |
| Minor layout adjustments | Manual positioning | Click-through rate |
Once a thumbnail improves CTR and watch time together, stop optimizing it. Once it performs, stop iterating.
FAQs
How do I know if my thumbnail is hurting views?
Your thumbnail might be costing you views if impressions go up but impressions CTR goes down. That usually means more people are seeing the video, but fewer are clicking.
There’s another angle too. If CTR stays high but average view duration or watch time falls, the thumbnail may be selling an idea the video doesn’t cash in on. In plain English: people click, then leave.
To check this, head to YouTube Studio → Analytics → Reach. Compare:
- Impressions
- Impressions CTR
- Retention / AVD, with extra attention on the first 30 seconds
Use a 7–14 day window before the thumbnail change and the same 7–14 day window after it. That side-by-side view makes it much easier to spot whether the new thumbnail helped, hurt, or just pulled in the wrong clicks.
Should I optimize thumbnails differently for Search and Browse?
Yes. Search and Browse reflect different viewer intent and different click-through-rate expectations.
For Search, aim for a clear match with the query and the title. Keep the thumbnail focused on one main subject and use short text.
For Browse/Home, lean into higher-contrast visuals and stronger emotional cues to grab attention fast, while still protecting watch time and retention.
What should I test first in a thumbnail?
Start with the biggest likely CTR driver: background color, brightness, or overall contrast. Change one main element at a time, wait at least 48 hours, and let the test run for 7–14 days with about 1,000+ impressions per version.
After that, test facial expression, then move to major text changes. Judge results by CTR first, then check watch time and retention to make sure the click led to good viewing behavior.