
How to Use Analytics for Thumbnail Insights
A thumbnail can win the click and still hurt the video. I look at 4 numbers first: impressions, CTR, average view duration, and audience retention. If CTR is low, the thumbnail may not be doing its job. If CTR is high but viewers leave fast, the thumbnail may be promising the wrong thing.
Here’s the short version:
- I use impressions + CTR to judge the pre-click side.
- I use AVD + retention to judge the post-click side.
- I compare results by video, traffic source, and time period.
- I test one clear change at a time.
- I log each result so the next thumbnail starts from data, not guesswork.
A few numbers help frame this fast:
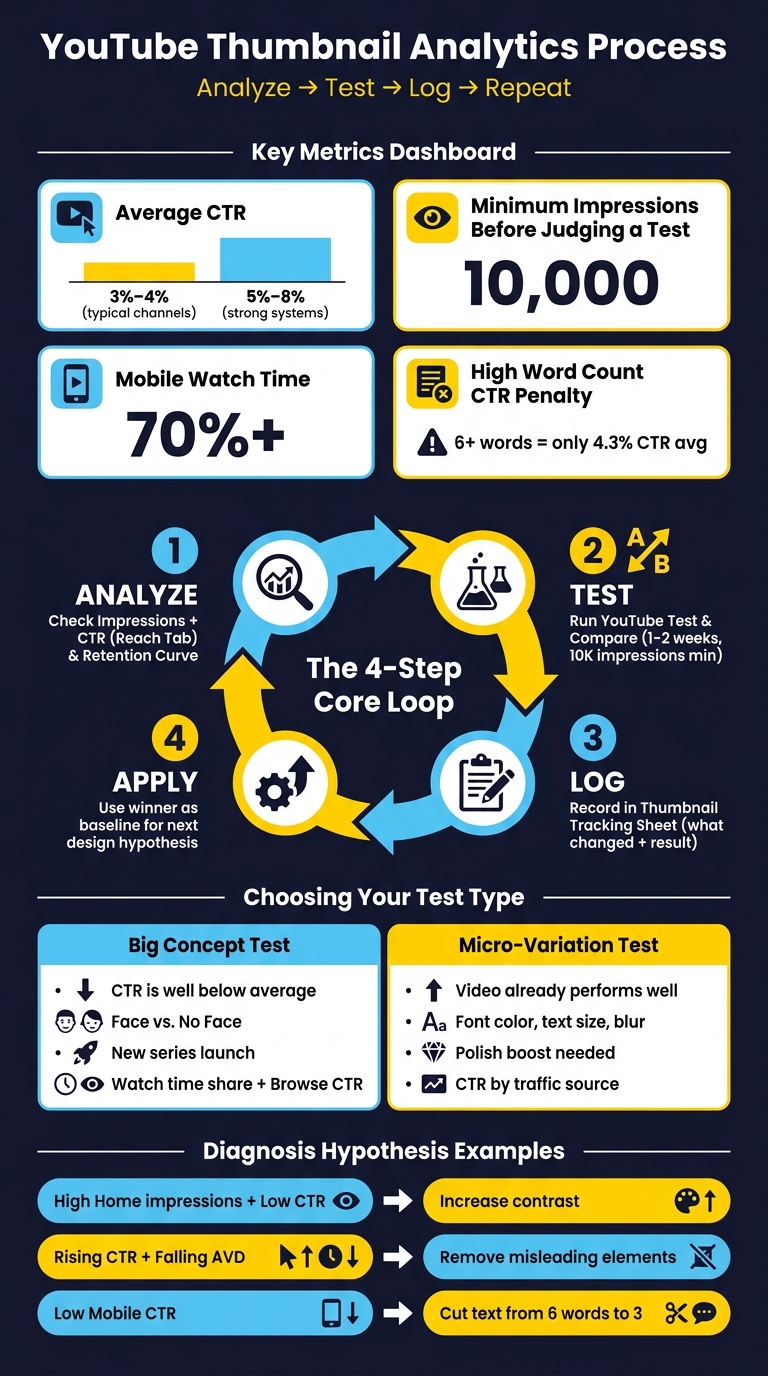
- Many channels sit around 3% to 4% CTR
- Strong systems often land around 5% to 8% CTR
- I wait for enough data before judging a test, often around 10,000 impressions
- More than 70% of watch time happens on mobile
If I had to sum up the process in one line, it would be this: check clicks, check watch behavior, test one change, then keep the winner.
That’s what this article covers.
YouTube Thumbnail Analytics: The 4-Step Repeatable Process
Use YouTube Analytics to Find Strong and Weak Thumbnails
Check Impressions and CTR by Video and Traffic Source
Open the video in YouTube Studio and head to the Reach tab to check impressions and CTR. If you want a channel-level view, go to Analytics → Content and click the Videos chip. That lets you scan all uploads in one place. It’s the fastest way to spot which videos should get a thumbnail update first.
Then look at traffic sources. The How viewers find your videos report breaks performance into Search, Browse (Home), Suggested Videos, and External. This matters because a thumbnail can do fine in one place and struggle in another. If one source is clearly weaker than the rest, that’s a strong clue the thumbnail isn’t doing its job there.
It also helps to split your review into two time periods: the first 48 hours and everything that comes after. Early performance often shows how well the thumbnail hooked people at launch. Later performance can show whether it kept working over time.
Use Retention to Confirm Whether the Thumbnail Set the Right Expectation
Open the video’s analytics and check the audience retention curve. If CTR is strong but the graph drops hard in the first 30 seconds, the thumbnail likely promised more than the video delivered. In plain English: people clicked, then bounced.
YouTube Studio also shows a typical retention range based on your last 10 videos of similar length. If the video lands well below that range, the issue may not be the topic alone. The thumbnail may have set the wrong expectation. At that point, compare it with thumbnails from videos that held attention better.
Compare Current Videos with Your Top Performers
After you spot a weak performer, sort the Content tab by impressions and study your top videos. Put the thumbnails side by side and look for patterns that keep showing up, like:
- Close-up faces
- High contrast
- Short text
Don’t treat those patterns as rules. Treat them as test ideas. This helps you move beyond A/B testing vs gut feeling when deciding on changes. If your top videos keep leaning on the same visual cues, that gives you a solid starting point for the next thumbnail A/B test.
sbb-itb-b59debf
Run Thumbnail Tests and Track Results
Use YouTube Test & Compare When Available
When your analytics start showing a pattern, test that pattern head-on. YouTube's Test & Compare tool lets you run up to three thumbnail versions on desktop and chooses a winner based on watch time share, not CTR alone.
That detail matters. If your analytics already pointed to low CTR, weak traffic-source performance, or a mismatch between clicks and retention, use that input to shape the test. You're not guessing here. You're checking whether a different thumbnail idea can fix the problem you already spotted.
Let each test run for 1–2 weeks, based on impression volume. YouTube needs about 10,000 impressions before the result starts to mean much statistically. Change the thumbnail too soon, and you're responding to noise instead of signal. Make the versions too close to each other, and the test may come back inconclusive.
If you're just getting started with the tool, test on older videos first. That's a safer way to learn how the system works without putting more pressure on a new upload.
Choose Between Big Concept Tests and Small Design Tweaks
The size of the test should match the problem your analytics found.
A big concept test makes sense when CTR is weak, a video is lagging, or you're rolling out a new series. Here, you're testing very different ideas, like face vs. no face or product vs. action shot. The point is to find a different visual hook or direction.
A micro-variation test fits a thumbnail that's already doing pretty well but could use a small bump. In that case, change one detail at a time, like text color, background brightness, or font size. That way, you can tell what actually moved the numbers.
| Big Concept Tests | Micro-Variation Tests | |
|---|---|---|
| Purpose | Find a new visual direction or hook | Optimize an already successful concept |
| Variables | Face vs. no face; product vs. action shot | Font color, background blur, text size |
| Metrics to Watch | Watch time share, Browse CTR, AVD | CTR by specific traffic source |
| When to Use | New series or when CTR is well below average | When a video performs well but needs a polish boost |
Log Results in a Simple Thumbnail Tracking Sheet
A tracking sheet helps turn test results into future design choices instead of a pile of old notes. Keep it simple, but make sure it explains what changed and what happened after.
At a minimum, track:
- Original concept
- Updated variant
- Change made
- Result
The notes column is where a lot of the learning happens. Be specific. Write things like "increased face size by 20%" or "switched text from white to yellow". Small details like that make it much easier to spot patterns later.
Use the winning version as the baseline for the next redesign.
Apply Analytics Findings to New Thumbnail Designs
Turn Data Patterns into Design Hypotheses
Use your tracking sheet as the brief for the next thumbnail. CTR benchmarks in YouTube Studio, along with your test results, give you something you can act on. Instead of making a fuzzy guess, you can make one clear change and see what happens.
The pattern tells you what's off. The hypothesis tells you what to change. For example:
- High Home impressions, low CTR → Increase contrast.
- Rising CTR, falling AVD → Remove misleading elements.
- Low mobile CTR → Cut text from 6 words to 3.
Over 70% of YouTube watch time happens on mobile. Thumbnails with 6 or more words average a CTR of just 4.3%. That's why it helps to change only one part at a time, like the face, background, or text. If you change three things at once, it's hard to know what did the job.
Once the hypothesis is clear, move from diagnosis to editing.
Create Faster Revisions with ThumbnailCreator
Turn each hypothesis into a fast thumbnail variant. At this stage, speed counts.
ThumbnailCreator fits this part of the workflow. Its AI-powered features - face swapping, object swapping, text editing, and template-based generation - let you change specific parts of an existing thumbnail without rebuilding the whole thing from scratch. Say you want to test a bigger face. You can swap it in, change the scale, and export a test version in minutes.
Workflow: spot a CTR issue in YouTube Studio → form a hypothesis → open ThumbnailCreator → make the isolated change → create a test variant.
Pick the Right Tool for Each Stage of the Workflow
Use Studio to diagnose and ThumbnailCreator to build.
| Tool | Main Use | Role | Key Strengths | Best Workflow Moment |
|---|---|---|---|---|
| YouTube Studio | Performance diagnosis | Data | First-party CTR, traffic source breakdown, watch time share data | Identifying which video needs a new thumbnail |
| ThumbnailCreator | Rapid iteration | Design | AI face/object swapping, template speed, text editing, mobile previewing | Creating variants for a Test & Compare run |
Test YouTube Titles & Thumbnails to Increase CTR – Full Tutorial
Conclusion: Build a Repeatable Thumbnail Analytics Process
Once you can diagnose and test thumbnails, the next step is making that work repeatable.
A repeatable thumbnail process has four steps: check impressions and CTR, (key metrics in the thumbnail glossary) confirm what you're seeing with retention data, test one clear change at a time, and carry that lesson into the next design. Do this every week, and thumbnail decisions start to feel a lot less like guesswork. You’re building a system.
A simple weekly loop keeps things moving. Review performance, test one change, and apply the winner to the next upload.
Use impressions and CTR to spot thumbnail problems. Then use retention to check whether the thumbnail’s promise matched the video. The core loop is simple: analyze, test, log, repeat.
After each test, move the winning idea into your next design cycle. Generate variants in ThumbnailCreator, then test the top option in YouTube Studio. Log the result, and use that data to shape your next hypothesis. Over time, your tracking sheet becomes a go-to reference for what your audience responds to.
FAQs
How do I know if a low CTR is really a thumbnail problem?
Check YouTube Studio metrics in the Reach tab, then filter CTR by traffic source. That gives you a cleaner read on what’s going on.
If CTR is below 8% for Search or 3.5% for Browse, the thumbnail may not line up with search intent or may not stop the scroll.
There’s another angle here too. If CTR is high but average view duration is low, the thumbnail might be pulling people in with the wrong promise. In plain English: people click, then bail.
And don’t judge too early. Wait until the video has at least 1,000 impressions before you size up performance.
What should I do if my thumbnail gets clicks but viewers leave quickly?
If your thumbnail gets clicks but people leave fast, there’s probably a gap between what the thumbnail promises and what the video gives them. That mismatch can break viewer expectations and hurt recommendations.
Keep the thumbnail in line with the actual video. Then make good on that promise within the first 30% of the video. In YouTube Studio, check your audience retention reports to spot where viewers start dropping off.
How long should I wait before judging a thumbnail test?
Wait 2 to 3 days after publishing before you start a test. That short delay helps filter out early views from loyal subscribers, which can skew the data.
After the test goes live, give it 7 to 14 days to produce results you can trust. If the video gets fewer than 10,000 impressions per week, expect the test to take longer.
As a rule of thumb, try to get at least 1,000 to 2,000 impressions for each thumbnail variant.