

How to Measure Thumbnail A/B Test Results
A thumbnail test only counts as a win if it gets more clicks and keeps people watching. If CTR goes up but watch time, average view duration, or early retention drop, I would not call that a winner.
Here’s the short version:
- I’d check CTR first in YouTube Studio
- Then I’d review 30-second retention, average view duration, and total watch time
- I’d wait at least 72 hours and aim for 1,000 impressions per variant at minimum
- For closer tests, I’d rather see 2,000–5,000 impressions per variant
- If results are within about 0.3–0.5 percentage points, I’d usually treat them as unclear
- I’d compare results by Browse, Search, and Suggested, not just blended totals
- I’d only keep a higher-CTR thumbnail if engagement stays flat or improves
A simple rule helps: more clicks from the wrong viewers is not a win. The best thumbnail brings in qualified clicks.
This article shows how I’d read CTR gaps, judge if the sample is big enough, check retention for mismatch, and log what happened so the next test is easier to judge, especially when testing at scale.
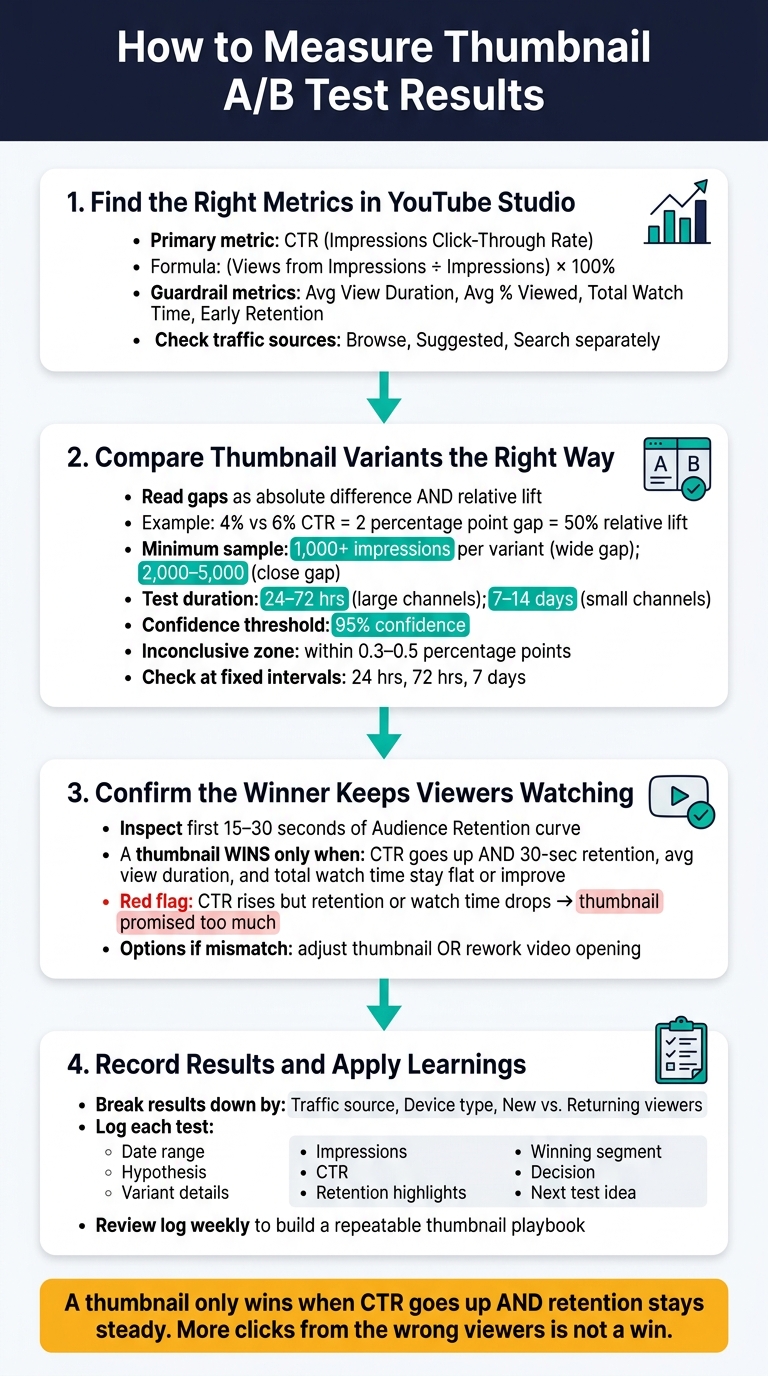
How to Measure Thumbnail A/B Test Results: A 4-Step Framework
A/B Test YOUR YouTube Thumbnails For FREE! [A/B Testing Tutorial]
sbb-itb-b59debf
Step 1: Find the right metrics in YouTube Studio
Open YouTube Studio and look at the numbers that tell you if one thumbnail is pulling more views than the other. A thumbnail doesn’t win just because it gets more clicks. It only wins if it gets more clicks and keeps people watching. Start with CTR, then check retention to make sure the click was worth it.
Use CTR as the main metric for thumbnail performance
In Analytics > Reach, check Impressions click-through rate. This is the main metric for thumbnail performance.
CTR = (views from impressions ÷ impressions) × 100%.
If Variant A gets a 5.2% CTR and Variant B gets 7.8% across a similar number of impressions, Variant B is doing a better job turning impressions into views. That’s the whole point of a thumbnail. Use CTR to spot the front-runner, then check retention and traffic source data before you make the call.
Use audience retention and watch time as guardrail metrics
CTR tells you who clicked. Engagement tells you if the thumbnail lined up with what people got after the click.
Head to Analytics > Engagement and look at whether those clicks turn into watch time. The main numbers to watch are:
- Average view duration
- Average percentage viewed
- Total watch time
- Early retention
Pay close attention to the first 15–30 seconds. If you see a steep drop there, that’s a warning sign. A higher CTR doesn’t mean much if viewers bail right away. If early retention falls, the higher CTR isn’t a win.
Check impressions and traffic sources before deciding on a winner
Don’t compare thumbnails by total impressions alone. Compare them by source too.
Only compare variants when impressions are close enough to make the result worth trusting. If one variant has only a small share of the other’s impressions, you need more data before picking a winner.
Under the Reach tab, YouTube breaks impressions out by source, including Browse features, Suggested videos, and Search. Check Browse, Suggested, and Search one by one before you name a winner.
Step 2: Compare thumbnail variants the right way
Don’t just pick the thumbnail with the highest CTR and call it a day. Once you’ve confirmed that CTR is your lead metric, the next job is to compare variants based on how big the gap is and how much you trust that gap.
Read CTR differences as percentage points and relative lift
There are two ways to read a CTR gap: absolute difference and relative lift.
Let’s say Variant A has a 4.0% CTR and Variant B has a 6.0% CTR. The absolute difference is 2.0 percentage points because 6.0% − 4.0% = 2.0%. The relative lift is 50% because (6.0 − 4.0) ÷ 4.0 = 0.50.
That second number matters more than many people think. A jump from 2% to 4% may look like the same 2-point gain as 12% to 14%, but it’s a much bigger move in context.
Use sample size and test duration to judge reliability
A CTR gap doesn’t mean much if you don’t have enough data behind it. As a practical rule, try to get at least 2,000–5,000 impressions per variant before you treat the result as serious, especially when the CTRs are close.
If the difference is wide, like 4% vs. 9%, then 1,000+ impressions per variant can still give you a decent read on direction.
Time matters too. Smaller channels may need 7–14 days to gather enough impressions. Larger channels can sometimes hit that range in 24–72 hours.
If your testing tool or YouTube’s experiment features show a confidence score, use it. A 95% confidence threshold is the bar to aim for. Anything below that is better treated as directional, not final.
Call a close result inconclusive when the data is unclear
Sometimes the right answer is: there isn’t a winner yet.
If two CTRs are within 0.3–0.5 percentage points of each other and both variants have a solid sample size, the result is often inconclusive. That usually means the thumbnails are too similar to produce a meaningful difference.
At that point, test something more distinct next, like:
- a new background color
- a different facial expression
- text-heavy vs minimal text designs
Also watch for results that swing back and forth over time. That’s usually a sign the test isn’t stable yet. Set your minimum thresholds before the test starts, then stick to them. For example, wait until each variant has 2,000+ impressions and at least 5–7 days of data, even if the early numbers look tempting.
It also helps to check results on a fixed schedule, such as 24 hours, 72 hours, and 7 days. That keeps you focused on steady patterns instead of getting pulled around by early noise.
Once the result looks stable, move to retention before you name a winner.
Step 3: Confirm the winning thumbnail keeps viewers watching
Once CTR points to a likely winner, make sure that thumbnail still keeps people watching. CTR tells you which thumbnail got the click. Retention tells you whether that click meant anything.
Check early retention for signs of mismatched expectations
The first 15–30 seconds usually tell the story fast. If the thumbnail sets one expectation and the video opens somewhere else, people bounce.
Open the Audience Retention report in YouTube Studio and compare the opening segment for each variant. One clear warning sign: the new thumbnail’s curve drops faster than the control’s in that early window, while the rest of the curve looks about the same. That often means the thumbnail sold a promise the video didn’t pay off right away.
For example, a dramatic “before and after” thumbnail result can trigger a steep drop around the 10–20 second mark if the video starts with a generic intro instead of getting straight to the point. In that case, you have two options:
- Adjust the thumbnail so it matches the video more closely
- Rework the opening so it delivers on the promise faster
If the opening curve looks clean, then check the rest of the watch time and average view duration data before you call the test.
Compare watch time and average view duration side by side before picking a winner
A thumbnail can win on CTR and still lose where it counts. If clicks go up but retention at 30 seconds, average view duration, and total watch time go down, it’s not the better thumbnail.
That kind of result looks good at first glance, but it’s a trap. More people clicked, sure, but fewer stuck around.
Only count a CTR lift as a win when retention holds up
Use one simple rule to keep the call clean: a thumbnail only wins when CTR goes up and retention at 30 seconds, average view duration, and total watch time stay flat or improve.
If CTR rises but retention or watch time fall outside those thresholds, treat the result as a red flag, not a win. Usually, that means the thumbnail promised too much and pulled in the wrong viewers. Over time, that pattern can cut future recommendations and impressions across the channel. A real winner gets the click and keeps people watching.
Step 4: Record results and apply what you learned to future thumbnails
After you confirm a real winner, don't let the lesson slip away. One test helps. A record of 10 tests starts to look like a playbook.
Break down results by traffic source, device, and new vs. returning viewers
Check CTR by traffic source, device, and new vs. returning viewers so you can see where the result actually holds. That matters more than people think.
A thumbnail might win on mobile Browse but do nothing on desktop. Or it may pull in new viewers but fall flat with returning viewers. That's the kind of pattern you want to catch early.
Use those segment patterns to turn one win into a repeatable rule. But be careful here: only treat a segment win as a rule when it stays steady across enough impressions and retention also holds.
Keep a simple test log for each thumbnail you test
Once you know where the result holds, write it down right away. A simple test log makes this easy. It helps you track what changed, what won, and what to test next.
Each entry should include enough detail to rebuild the test later and do something with the result. Here's a practical format:
| Date Range | Video | Hypothesis | Variant A (Control) | Variant B (Test) | Impressions (A/B) | CTR (A/B) | Retention Highlights | Winning Segment | Final Decision | Next Test Idea |
|---|---|---|---|---|---|---|---|---|---|---|
| 06/01/2026–06/07/2026 | How to Design YouTube Thumbnails in 10 Minutes | Bigger face and fewer words will improve mobile Browse CTR without hurting retention. | White background, small face, 8-word title text, no strong emotion. | Bright yellow background, close-up surprised face, 3-word text: Thumbnail Hack. | 42,000 / 40,500 | 4.8% / 7.1% | Avg view duration: 4:12 (A) vs. 4:05 (B); 30-second retention: 72% (A) vs. 70% (B). | Mobile Browse and Suggested | Choose Variant B as the default thumbnail | Test benefit-based text ( +50% CTR ) vs. curiosity text (Thumbnail Hack) using the same layout |
Review the log every week to spot repeating winners and recurring retention drops. After a while, those patterns become your own thumbnail playbook.
Build and test new variants faster with ThumbnailCreator
Then make the next test easier to launch. In a lot of cases, testing slows down during variant creation, not analysis.
Use ThumbnailCreator to build the next set of thumbnail variants faster. Then use YouTube Studio and your log as the source of truth.
Conclusion: How to decide whether your thumbnail test produced a real winner
A thumbnail test has a real winner when CTR goes up and retention stays steady. That's the main test.
If clicks climb but people drop off in the first 30–60 seconds, the thumbnail is likely promising more than the video delivers. That’s not a win you want to keep.
Before you make the call, check three things:
- Did the test run long enough?
- Did the higher-CTR thumbnail keep retention and watch time in place?
- Did it hold or improve average view duration?
If the answer to any of those is no, the result still needs more time.
A real winner brings in qualified clicks. A thumbnail that gets viewers to click and keep watching matters more than one that pumps up CTR while dragging down watch time.
If it clears those checks, and you’ve confirmed the winner across CTR, retention, and key segments, log it and move to the next test.
The best thumbnail earns the right clicks.
FAQs
What if CTR goes up but retention drops?
If CTR goes up but retention falls, your thumbnail may be selling one thing while the video delivers another. People click, then bounce. And YouTube usually reads that as a bad sign, which can hold back your video’s reach.
Here’s a simple way to spot the problem:
- If average watch time drops by more than 5%
- If more than 40% of viewers leave in the first 30 seconds
At that point, the thumbnail is likely hurting performance. Swap it for one that lines up better with the video and sets clear expectations.
How long should I run a thumbnail test?
Prioritize data volume over time. A good rule of thumb is 500–1,000 impressions per variant. If you can get to 2,000–5,000 impressions, your read on the results is usually much stronger.
Also, let the test run for at least 48 hours so early spikes don't throw you off. On most channels, 3–14 days is pretty normal. And whatever you do, don't call it too soon. Wait until the result is clear.
Should I judge results by traffic source?
Yes. Traffic source matters because YouTube surfaces work in different ways, and your overall CTR is a blended metric that can hide weak spots.
A thumbnail might perform well in Search, where people already know what they want, but fall flat on Home, where viewers are just scrolling. When you filter by traffic source in YouTube Studio, you can see whether the thumbnail works in each setting or if it needs a tweak.