

How to Use Retention Graphs to Optimize Content
I use retention graphs to find where viewers leave, check what happened, and test one change. I start with a sharp drop, review the nearby footage, and look for a slow opening, repeated point, or unclear step.
Here’s my process:
- Set a baseline: Compare average view duration, average percentage viewed, and graph shape across 10 similar videos.
- Check the pattern: Review the first 30 seconds, sudden dips, and replay spikes. A spike can mean interest or confusion - not automatic success.
- Test one fix: Show the promised result earlier, cut repetition, clarify instructions, or better match the opening to the title and thumbnail mistakes to avoid.
- Measure again: Compare the same first-28-day window, accounting for traffic sources and audience mix.
My rule: <u>treat each pattern as a clue, not proof</u>. The goal isn’t a perfect curve. It’s a clear next step for your next video.
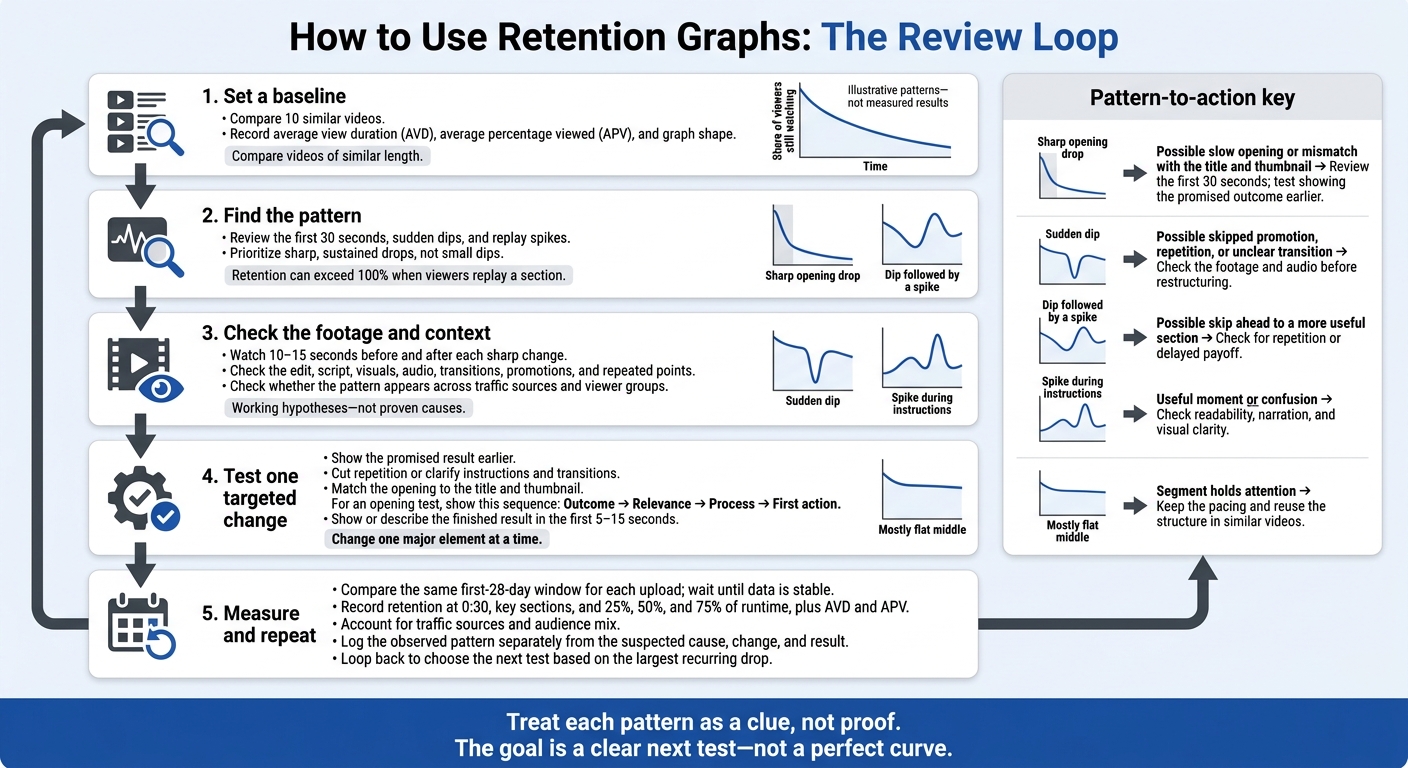
How to Use Retention Graphs: The Review Loop
How to Read Your YouTube Audience Retention Graph Like a Pro
sbb-itb-b59debf
Read Retention Patterns and Find Drop-Offs
Retention curves show where viewers stop watching. Use those moments to check which content choices might explain the drop. Read the graph from left to right: the horizontal axis shows time, and the vertical axis shows the share of viewers still watching. Retention can exceed 100% when viewers replay a section, so the curve reflects viewing behavior, not a count of individual viewers. Start by finding the exact timestamps where the curve changes shape.
Understand Flat Sections, Dips, and Spikes
Flat sections point to pacing worth keeping. Dips suggest possible friction, while spikes can mark useful moments - or confusing ones.
A sharp opening drop needs a different review than a gradual decline. Check the first 30 seconds for a slow payoff or an opening that doesn't match the title and thumbnail. A gradual decline usually reflects normal viewer attrition rather than one moment you can fix. When the data is available, compare new and returning viewers, subscribers and non-subscribers, and traffic sources.
Review What Happens at Each Timestamp
Watch 10–15 seconds before and after each sharp change. Review the edit, script, and visuals together. Look for introductions, transitions, promotions, repeated points, silent gaps, audio changes, and visuals that are hard to follow. Each possible cause is something to check, not a proven explanation.
Use the pattern to narrow down the cause, then decide whether to adjust pacing, clarity, or payoff timing.
| Graph pattern | Possible explanation | Recommended response |
|---|---|---|
| Sharp opening drop | The opening is slow or doesn't match the title and thumbnail. | Review the first 30 seconds and test showing the promised outcome earlier. |
| Sudden dip | Viewers skipped a promotion, repeated point, or unclear transition. | Check for promotions, detours, confusing transitions, or poor audio. Restructure that type of segment if needed. |
| Dip followed by a spike | Viewers skipped ahead to a more useful section. | Check whether the skipped material repeats earlier points or delays the payoff. |
| Spike during instructions | The step is useful or hard to follow. | Check text readability, narration, and visual clarity before simplifying the step or adding detail. |
| Mostly flat middle | The segment holds attention. | Keep the pacing and reuse that structure in similar videos. |
Check Possible Causes Before Editing
Before making changes, check whether the drop appears across traffic sources and viewer groups. Look for audio or visual changes at the same timestamp, too. Treat your explanation as a working hypothesis, then test it in the next upload.
For replay spikes, check whether viewers can follow the key step easily. A useful demonstration might work better with a close-up or chapter. Unclear instructions may need simpler wording and clearer on-screen cues. Not every dip calls for a shorter video, and not every spike means viewers are satisfied: they may skip an optional section or replay something they didn't understand.
Use Retention Findings to Plan Content Changes
Turn each drop point into a specific edit to test.
Start with sharp, sustained drops, not small dips. Log the timestamp, drop size, viewer segment, and proposed edit. Compare the pattern with videos of similar length before choosing your first fix.
Make small trims now. Save rewrites, reordered demonstrations, and new footage for the next upload.
Show the Promised Result Earlier
If viewers leave before the main demonstration, test an opening that follows this order: outcome, relevance, process, first action.
In the first 5–15 seconds, show or describe the finished result. Explain who the video is for and which problem it solves, briefly preview the steps, then start the first useful demonstration. This structure helps you test whether viewers left because they waited too long for something useful.
Cut Repetition and Clarify Transitions
If a dip lines up with a repeated section, keep one clear explanation alongside the relevant action. Cut extra repetition, use direct cuts when continuity is clear, and add a short visual label when the task changes.
When viewers replay a useful demonstration, don't just make it longer. Plan a clearer close-up, a slower screen recording, on-screen values, or a chapter marker to help them follow the steps.
Match the Thumbnail and Title to the Video
Test whether the title and thumbnail match what the opening delivers. Then track CTR, opening retention, and watch time by traffic source and audience type.
Change one major element at a time. Use the next similar uploads to check whether the change improved retention.
Measure Results Across Similar Uploads
After one test, compare the next upload with similar videos to see whether the retention pattern repeats. Use the same first-28-day window for each upload, and wait until the data is stable. Account for traffic sources and audience mix before judging the results.
Compare Opening Retention and Viewing Metrics
Record retention at 0:30 and key sections, along with average view duration (AVD) and average percentage viewed (APV). Check the graph at 25%, 50%, and 75% of runtime, too. A stronger opening can hide losses later in the video. Keep the comparison window consistent across the set.
Video Length Window Retention at 0:30 AVD APV Traffic/audience mix Beginner camera setup 10:00 First 28 days 72% 5:18 53% 62% Browse; established subscribers Budget camera setup 9:30 First 28 days 66% 4:42 49% 48% Search; more new viewers Camera mistakes to avoid 10:15 First 28 days 78% 5:56 58% 55% Suggested; stronger returning audience
Read these results alongside the graph’s shape to judge whether the changed section held viewers longer. Differences in topics and audience mix limit what you can infer. Check typical retention against your 10 latest uploads of similar length. Record the review date and comparison group.
Keep a Retention Review Log
Use the same log format for every test so you can compare patterns later. Include the date, URL, comparison window, timestamp, pattern, suspected cause, change, and result. Keep the data separate from your interpretation, and record follow-up opening retention, AVD, and APV.
Test one main change at a time, and note any secondary changes. Treat comparisons across uploads as clues, not proof of cause and effect. Choose the next test based on the largest recurring retention drop.
Conclusion: Repeat the Retention Review Process
Make retention review a loop: gather data, look for patterns, check the content, make one targeted change, and measure again. Titles and thumbnails, openings, and pacing should match what viewers clicked for.
After each review, move straight to one testable change. Start with the largest drop-off in a recent video. Watch 15–30 seconds before and after it, then record one change to test in your next upload. Schedule the follow-up review before publishing. Aim for a clearer next decision, not a perfect graph.
FAQs
How many views do I need for reliable retention data?
Reliable retention and thumbnail insights depend on impressions - not views alone. Aim for at least 1,000 to 2,000 impressions per thumbnail variant to limit the influence of early swings or loyal subscribers.
For more dependable results, aim for at least 10,000 total impressions across all variants. Wait at least 7 to 14 days before making changes so you’re responding to audience behavior, not short-term noise.
What is a good retention rate for my video length?
Good retention depends on video length. Use these targets as a guide:
| Video length | Retention target |
|---|---|
| Under 5 minutes | 65%–75% |
| 5–10 minutes | 50%–60% |
| 10–15 minutes | 40%–50% |
| 15 minutes or longer | 35%–45% |
| Shorts | 70%–85% |
Shorter videos generally need higher completion rates.
Whatever the length, pay close attention to the first 30 seconds. A steep drop often suggests your thumbnail set expectations the video didn’t meet.
What if retention improves but total views drop?
Better retention with fewer views often means your content connects with a smaller, more interested audience. High retention signals viewer satisfaction and engagement to YouTube’s algorithm.
If your click-through rate (CTR) drops too, your thumbnail may be holding you back. Use ThumbnailCreator to refine it so it accurately reflects your content and draws viewers who’ll appreciate it. Aim to keep engagement strong as you gradually reach more people.