

How to Compare Thumbnail CTR Across Styles
I compare thumbnail styles by clicks AND what happens after the click. A CTR increase from 4.5% to 6.0% is a gain of 1.5 percentage points - but I check watch time and retention before calling it a win.
Here’s my approach:
- Set a baseline: Compare similar videos over the same reporting window, keeping Browse and Search results separate.
- Label the styles: Track faces, text, colors, and layouts before checking results. Compare median and impression-weighted CTR.
- Test on the same video: Try 2–3 thumbnail versions, change one major element, and keep the title fixed. YouTube’s Test & Compare judges results by watch time share, not CTR alone.
- Log and review: Save each design and its results, use winners on similar content, and retest every 3–6 months.
My rule: <u>More clicks don’t make a better thumbnail if viewers leave sooner.</u>
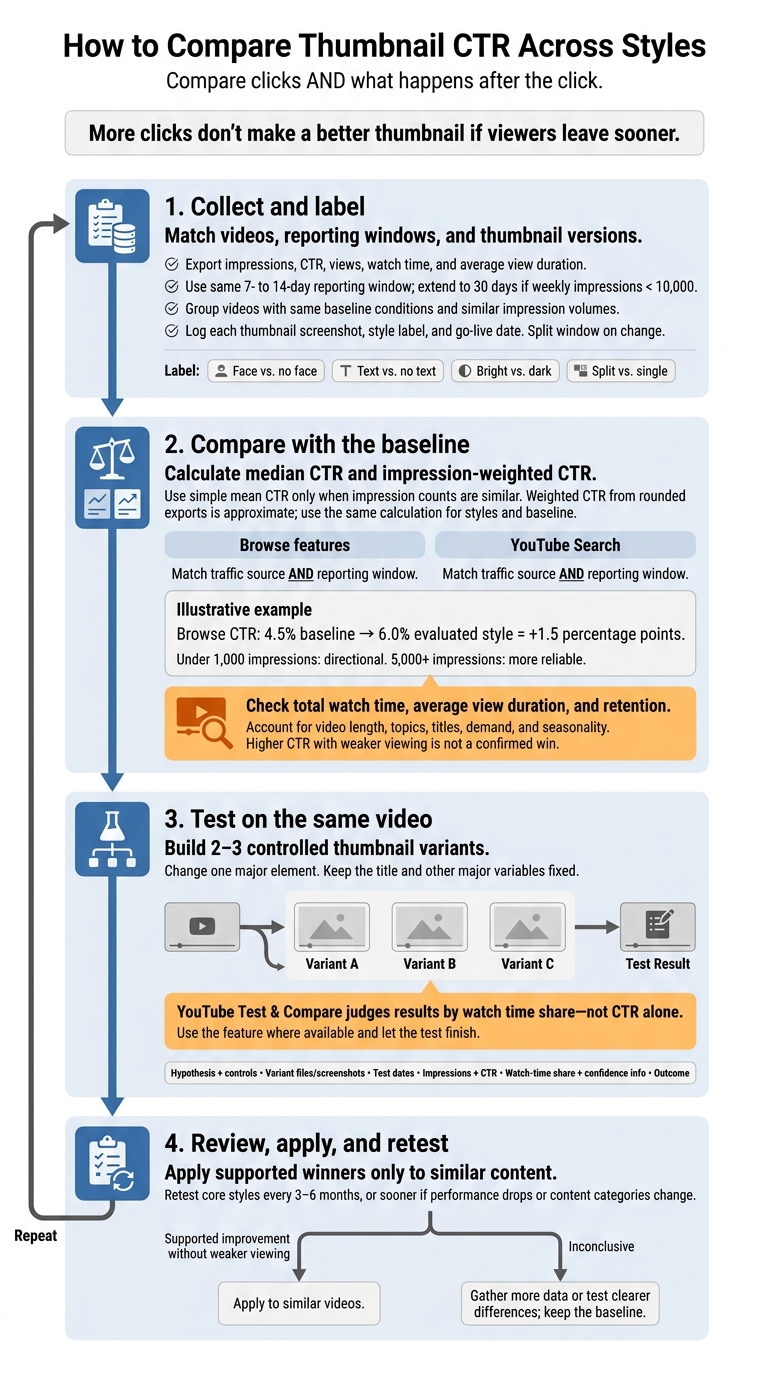
How to Compare Thumbnail CTR Across Styles
YouTube A/B Thumbnail Testing EXPLAINED!
sbb-itb-b59debf
Step 1: Collect Data and Label Thumbnail Styles
Log the matched videos and each thumbnail version before comparing results.
Collect Metrics From YouTube Studio
Export impressions, CTR, views, watch time, and average view duration for each video. Use the same 7- to 14-day reporting window across all videos. If weekly impressions stay below 10,000, extend the window to 30 days.
Keep a separate thumbnail log with a screenshot, style label, and the date each design went live. If you change a thumbnail during the reporting period, split the reporting window so each result lines up with the design shown at that time.
Group Comparable Videos
Once you’ve logged each thumbnail version separately, group videos with the same baseline conditions and similar impression volumes. Lower-traffic uploads usually need more time to build a reliable sample.
Label Each Thumbnail by Its Main Style
Define your labels before checking performance. Give each thumbnail one primary label based on its main hook:
Face vs. no face, text vs. no text, bright vs. dark color scheme, or split-screen vs. single scene.
Write a short definition for each label so similar designs get tagged consistently.
Track overlapping features in separate columns: text, faces, color temperature, background brightness, and layout.
Step 2: Compare Styles Against Your Channel Baseline
Once you’ve labeled your styles, calculate median CTR and impression-weighted CTR for each, then compare both with your channel baseline. Use simple mean CTR only when impression counts are similar.
Median CTR is the middle value. For an even number of videos, average the two middle values. Impression-weighted CTR accounts for reach across the group, while simple mean CTR gives every video equal weight. Weighted CTR from rounded exports is approximate, so use the same calculation for each style and its baseline.
Use this summary to rank styles against the baseline - not to report every possible metric.
Example values only.
Style Video count Median CTR Median impressions Median watch time per video, matched window Design attributes Expressive face 12 6.8% 15,000 4:45 Warm colors, surprised expression, close-up Minimalist/no text 10 5.9% 12,500 5:12 Photography, no text, enlarged subject Split-screen 8 8.7% 22,000 4:20 Before/after layout, high contrast, arrow
Next, break out each style by traffic source to separate Browse and Search performance.
Compare CTR by Traffic Source and Time Window
Build separate baselines for Browse features and YouTube Search. Match both the traffic source and reporting window in every comparison. Treat results under 1,000 impressions as directional; results with 5,000+ impressions are more reliable.
Example: a Browse CTR of 6.0% against a 4.5% baseline equals a +1.5 percentage-point difference.
Style Source Window Impressions CTR Baseline CTR Difference Style being evaluated Browse features Days 1–7 Not supplied 6.0% 4.5% +1.5 percentage points Style being evaluated YouTube Search Days 1–7 Not supplied Not supplied Not supplied Not calculated Style being evaluated Browse features Days 8–14 Not supplied Not supplied Not supplied Not calculated
Check Watch Time, Retention, and Style Trade-Offs
Read CTR alongside total watch time, average view duration, and retention in YouTube Studio. Viewing quality helps you judge whether a higher-CTR style performs better after the click.
Average view duration measures time, not a percentage. When comparing retention, account for video length. Higher CTR paired with weaker viewing may mean the thumbnail sets an expectation the video doesn’t meet - not that you’ve found a winner. Also account for topics, titles, demand, and seasonality before giving the design credit. Staying updated on YouTube thumbnail trends can help you contextualize these shifts. YouTube’s native thumbnail testing uses watch time share to help assess this trade-off.
Treat each style’s fit as a hypothesis to test, not a rule for your whole channel. Before using a style more broadly, check that it improves CTR without hurting retention on matched videos.
| Style | Design attributes | What to watch for |
|---|---|---|
| Expressive face | Warm colors, surprised expression, close-up | Whether the hook is clear and viewing stays steady |
| Minimalist/no text | Photography, no text, enlarged subject | Whether the topic is still clear without extra text |
| Split-screen | Before/after layout, high contrast, arrow | Whether it works better for transformation content than for purely informational content |
If one style wins on CTR without hurting viewing quality, test it on the same video in Step 3.
Step 3: Test Thumbnail Styles on the Same Video
Start with the pattern that performed best in past results. Compare your data against thumbnail CTR benchmarks to see how your current performance stacks up. Treat it as a hypothesis - not a proven rule. Build 2 or 3 controlled variants, then test them on the same video while keeping the title and other major variables fixed.
Create Test Variants With ThumbnailCreator
Use ThumbnailCreator to generate several concepts, then narrow them to 2 or 3 test variants. Change only one major element, such as the expression, amount of text, or subject. Log the finalists and test them in YouTube Studio.
Run YouTube A/B Tests and Log Results
Check whether your channel has access to YouTube’s Test & Compare feature. In YouTube Studio, open the video’s Details page, find the thumbnail testing option, and upload up to three variants where available. Let the test finish, then choose a winner after reaching at least 80% confidence.
Keep a simple Markdown log so you can compare tests later. Record the hypothesis, screenshots or file names, test dates, impressions and CTR for each variant, watch-time share, confidence level, and final conclusion.
| Log field | What to record |
|---|---|
| Hypothesis and controls | Expected effect and the one major element you changed |
| Variants | File names, screenshots, and design differences |
| Dates | Start and end dates |
| Impressions and CTR | Impressions and CTR for each variant |
| Watch time | Watch-time share and confidence information |
| Outcome | YouTube’s result and your final decision |
Conclusion: Review and Test Thumbnail Styles Regularly
Treat each test result as a decision rule - not a final verdict. Compare CTR gaps in percentage points, then check watch time share and retention as part of your advanced thumbnail optimization before using the style on more videos.
Use your test log to decide which winning styles to roll out across your channel. Apply them only to similar content, not every upload. Retest core styles every 3–6 months, or sooner if performance drops or you change content categories.
If results remain inconclusive, gather more data or test versions with clearer differences. Keep the current baseline as your default until a controlled test shows that another option works better.
FAQs
How can I tell if a CTR gain is meaningful?
A higher click-through rate (CTR) only counts if the gain is statistically significant and backed by viewer retention. Give each thumbnail variant at least 1,000 to 5,000 impressions over 7 to 14 days.
The winning thumbnail increases CTR without reducing watch time, average view duration, or early retention. Ideally, those metrics improve, too. If they drop, the thumbnail may be misleading viewers rather than accurately representing your video.
Why does CTR drop as impressions grow?
A lower click-through rate (CTR) as impressions grow is normal. It doesn’t automatically mean your design is poor. YouTube often shows your video to loyal subscribers first, then to a broader audience. Those viewers may be less familiar with your channel and less interested in the video, bringing down your overall CTR.
Your thumbnail also needs to match the content. If it promises something the video doesn’t deliver, viewers may click and then leave soon after. That can hurt future recommendations and impressions.
What if CTR rises but watch time falls?
A higher click-through rate (CTR) isn’t always a win. If CTR climbs while watch time falls, your thumbnail may promise more than the video delivers. Viewers might click, then leave soon after, which could hurt your channel’s long-term reach and recommendations.
Make sure your thumbnail matches the content and sets clear expectations. If average watch time drops more than 5%, or over 40% of viewers leave within the first 30 seconds, consider switching to a thumbnail that better reflects the video.