

YouTube Growth Metrics: Competitor Analysis Tips
If I want a clear read on competitor growth, I ignore lifetime totals and track a short window: the last 30 days, the last 10–20 uploads, and each video’s first 24–72 hours.
That gives me a simple way to tell whether another channel is growing now, staying flat, or slowing down. I also keep the comparison tight: 3–5 direct competitors, the same date range for each, and the same video sample size.
Here’s the short version of what matters most:
- Monthly views: shows current direction better than lifetime views
- Average views per video: shows how each upload is performing
- 24-, 48-, and 72-hour views: shows early traction by comparing them to top YouTube creators
- Uploads per month: shows posting pace
- Engagement rate: use (likes + comments) ÷ views × 100
- Subscriber gain per view: helps show whether views turn into audience growth
- Thumbnail and title patterns: help explain why some videos move faster than others
A few benchmark numbers can help:
- Smaller channels under 10,000 subscribers often see 6%–9% engagement
- Channels with 10,000–200,000 subscribers often land around 5%–7%
- Views-to-subscriber conversion often sits near 2%–5%
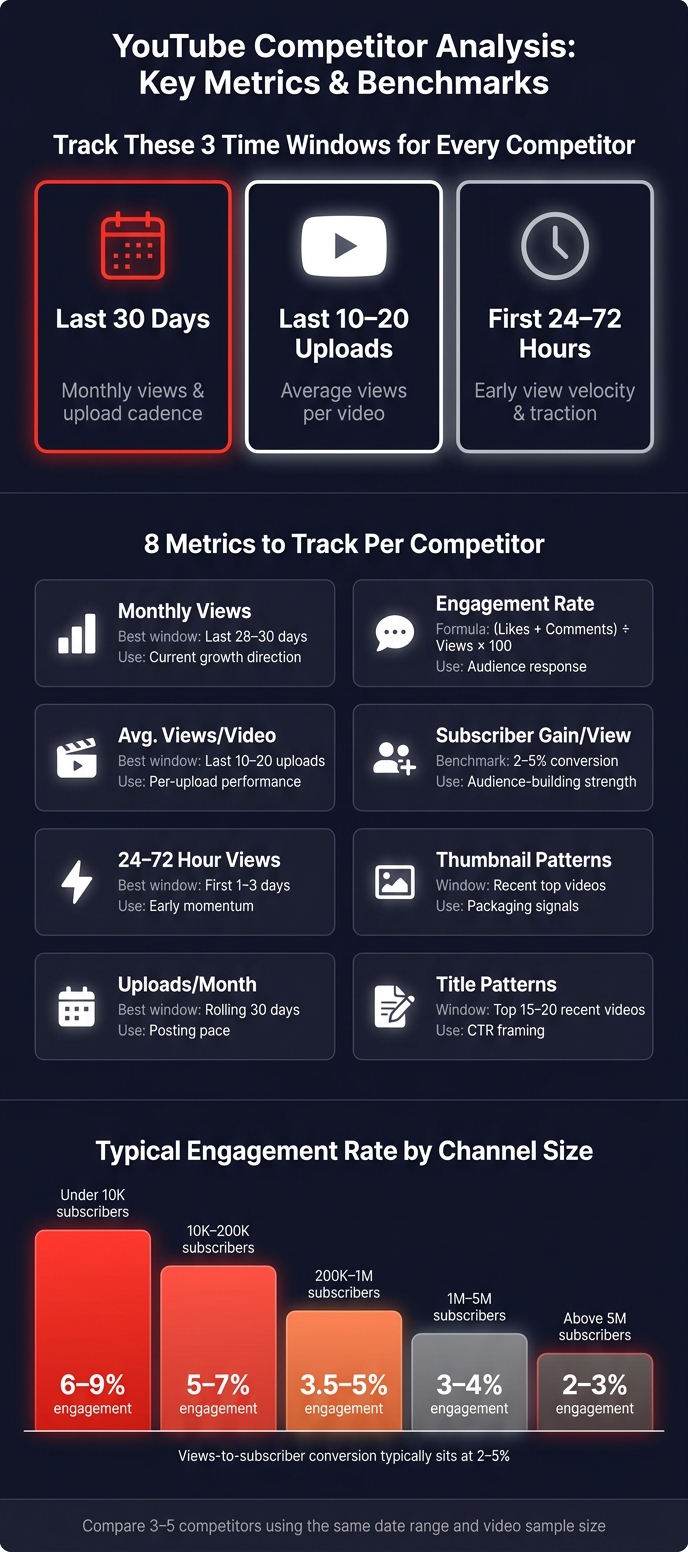
YouTube Competitor Analysis: Key Metrics & Benchmarks at a Glance
How To Do YouTube Competitor Analysis (Step-by-Step Guide for Growth, SEO and Content Strategy)
sbb-itb-b59debf
Quick Comparison
| Metric | What I use it for | Best time window |
|---|---|---|
| Lifetime views | Channel size only | All-time |
| Monthly views | Current growth direction | Last 28–30 days |
| Avg. views per video | Per-upload performance | Last 10–20 uploads |
| 24–72 hour views | Early momentum | First 1–3 days |
| Uploads per month | Posting pace | Rolling 30 days |
| Engagement rate | Audience response | Per video / monthly |
| Subscriber growth per view | Audience-building strength | Same 30-day window |
| Thumbnail and title synergy notes | Packaging patterns | Recent top videos |
I’d turn all of this into one simple sheet and update it weekly or monthly. That way, I’m not guessing why a competitor is moving - I can see the pattern in the numbers.
Checklist: Core view growth metrics to track each period
These metrics are the base of any competitor growth analysis. Track them weekly or monthly so you can spot patterns over time, not one-off jumps.
Total views, monthly views, and average views per video
Use lifetime total views as a rough size marker. But for growth, focus more on views gained in the last 28–30 days. Then pair that with average views per video across the last 10–20 uploads to get a more honest read on day-to-day performance.
When averages go up, it often means the channel is picking better topics or packaging videos better. When averages stay flat or start to drop, that usually points to weaker fit with the audience or simple audience fatigue.
View velocity in the first 24 to 72 hours
Most videos set their path in the first 24–72 hours. Strong early numbers often mean the title and thumbnail are doing their job, the topic has instant demand, or the channel has a loyal subscriber base that jumps in fast.
Log each competitor video at 24 hours, 48 hours, and 72 hours after it goes live. Then check again at the 30-day mark. This gives you a clean way to compare early traction with longer-term performance.
A video that bursts out fast and then stalls tells a different story than one that starts slow and keeps climbing. That slower climb often points to search traffic, recommendation traffic, or evergreen interest. It also shows which competitors are gaining speed right now, not just which ones are already big.
Upload cadence and publishing volume
Track how often each competitor publishes, and log total uploads per month next to their monthly view numbers. Posting more only means something when you read it alongside views per upload.
If a channel posts less but gets more views per video, topic choice and packaging are likely doing the heavy lifting. If it posts a lot but average views stay low, volume alone isn't doing much.
Use these as your weekly or monthly baseline:
| Metric | Tracking window | What higher numbers signal |
|---|---|---|
| Lifetime total views | Lifetime | Channel size, not growth |
| Monthly views | Last 28–30 days | Recent growth direction |
| Average views per video | Last 10–20 uploads | Stronger content-market fit |
| First 24-hour views | 24 hours after publish | Strong packaging and initial traction |
| First 72-hour views | 72 hours after publish | Early momentum holding beyond launch |
| Uploads per month | Rolling 30-day window | Volume vs. quality trade-off |
Next, check engagement to see which videos turned views into active audience response.
Checklist: Engagement and audience response metrics
Views show whether a competitor's packaging is doing its job. Engagement shows whether the content gave people enough reason to react. If engagement is low, the content probably didn't connect. So think of it this way: views show reach, while engagement shows whether that reach is actually landing. These metrics help you see whether view growth is turning into real audience response.
Likes, comments, and engagement rate by video
Use (likes + comments) ÷ views × 100. That gives you an engagement rate you can compare across channels of different sizes.
Channel size matters here. As channels get bigger, engagement rates tend to drop.
| Channel size (subscribers) | Typical engagement rate range |
|---|---|
| Under 10,000 | 6–9% |
| 10,000–200,000 | 5–7% |
| 200,000–1 million | 3.5–5% |
| 1–5 million | 3–4% |
| Above 5 million | 2–3% |
Likes show approval. Comments show a deeper kind of response. If a video has a lot of comments compared with its view count, that's usually a sign it sparked actual discussion. And that's often a stronger signal of audience investment than passive approval alone.
Compare videos in the same niche and format. Tutorials, Shorts, and opinion videos tend to produce very different interaction patterns, so side-by-side comparisons only make sense when the format is similar.
Comment velocity and repeat audience signals
Track how many comments each competitor video gets in the first hour, first 24 hours, and first 72 hours after it goes live. Fast comment growth can point to controversy, curiosity, or a strong emotional reaction. In plain English, a quick burst says more than a slow drip over time.
It also helps to look at who is commenting. Repeat usernames across multiple videos, viewers mentioning earlier uploads, or people asking for follow-up content all suggest that a channel is building a real community, not just pulling in one-off traffic. When you see the same pattern across three to five recent uploads, that's a much better sign of audience loyalty than one viral video with inflated comment counts.
Subscriber growth per view
Compare subscriber gain against views to see whether growth is pulling in returning viewers. A typical views-to-subscriber conversion rate sits around 2–5%.
If a channel falls well below that range, it's often getting broad search or recommendation traffic from topics that don't clearly match what the channel is about. That isn't always bad. Some channels are built around one-time informational traffic. But if the goal is audience building, weak conversion usually points to a positioning gap or a lack of steady series-based content that gives people a reason to subscribe.
If a video takes off but engagement stays weak, check thumbnail and title patterns next.
Checklist: CTR factors behind competitor growth
When views go up but engagement is mixed, packaging is often the next thing to check. In most cases, strong early view velocity comes from the thumbnail and title more than anything else.
You can’t see a competitor’s CTR directly. But you can make a solid read on packaging by watching how a video moves in its first few hours. If a video beats its usual 7-day pace within the first few days, that’s a strong sign the packaging is doing its job.
Thumbnail and title patterns on high-velocity videos
Review the top 15–20 recent videos for each competitor. Then look for patterns across the group, not one-off hits.
On the thumbnail side, fast-moving videos usually share a few traits: one clear subject, a strong face, high contrast, and 3–5 bold words. Thumbnails that cram in too much often fall apart on mobile, where most people are scrolling fast. It also helps to note whether the competitor sticks to the same brand signals, like a repeat font, accent color, or logo placement, across breakout uploads.
Titles on high-velocity videos usually fall into a few common frames:
- A curiosity gap, like I Didn't Expect This
- A clear benefit, like Save $500 On Your Next PC
- A warning, like Stop Doing This Now
The more specific titles tend to use numbers, named products, or clear outcomes. Track the average title length, whether numbers show up often, and which framing style appears most on the fastest uploads. Then connect those patterns to the videos that actually spiked, not just the ones that look good.
Track thumbnails and titles as separate parts, but judge them together. The thumbnail shows the conflict or result at a glance. The title adds context, stakes, or both. When a competitor lines those two up tightly, the video is more likely to hold watch time, which helps it keep growing.
Use the patterns you find to test ideas faster. ThumbnailCreator helps you try these setups fast with AI generation, templates, face swapping, text editing, and object swapping.
Build a simple competitor tracking sheet
Once you’ve logged the metrics above, put them in one simple sheet. That makes trends much easier to compare over time.
The best tracking sheet is easy enough to update every week or month without turning into a chore. That’s also where patterns start to stand out. You can see which competitor changed first, and whether that shift happened right before a spike in views.
Recommended columns for a weekly or monthly dashboard
Set up one row per competitor for each time window. And keep the date range the same across every channel in the sheet. If one channel is measured from September 1–30, every other channel should use that exact same range too.
Use these columns:
Channel name, date range, monthly views, average views per video, views in the first 48–72 hours on recent uploads, uploads per month, likes, comments, engagement rate, thumbnail/title notes, and action item.
Update it weekly for fast-moving niches and monthly for more stable ones.
Comparison table for side-by-side channel comparison
Use the dashboard to compare channels side by side.
| Channel | Monthly Views | Avg. Views/Video | Views in First 48–72 Hours | Uploads/Month | Engagement Rate |
|---|---|---|---|---|---|
| Channel A | |||||
| Channel B | |||||
| Channel C |
This table helps you spot gaps in reach, efficiency, and engagement at a glance.
FAQs
Why not use lifetime views?
Lifetime views are less useful when you're trying to judge growth. They tell you how a video has done over time, but they don't say much about what’s happening right now.
For that, metrics like view velocity in the first 48–72 hours are far more helpful. They show whether a video is picking up steam early, which is often a better sign of where it's headed.
Audience retention and viewer satisfaction matter more too. YouTube’s algorithm pays closer attention to those signals than to total views, which makes them stronger indicators of current performance and recommendation potential.
How many videos should I compare?
It depends on your goal.
- 10–15 videos if you want a general performance review
- 30–50 videos if you want to spot deeper patterns in upload frequency or posting schedules
- 10–20 videos for a thumbnail audit, ideally from the last 60–90 days
That range gives you a clear view of current growth trends without making the analysis too broad.
What if a video gets views but few subscribers?
If a video gets plenty of views but only a few subscribers, that usually means one thing: people are clicking, but they’re not sticking around as fans.
That’s why audience retention matters so much. YouTube cares more about viewer satisfaction and watch time than raw view counts alone. If people stay, watch, and enjoy the video, that sends a much stronger signal than a click by itself.
Use ThumbnailCreator to tighten up your packaging so your thumbnails and titles line up with the actual content. That helps bring in the right viewers instead of people who click and bounce.