

Ultimate Guide to AI Competitor Analysis for YouTube
If I want better YouTube results, I don’t study competitor channels by feel. I track patterns. The article’s core idea is simple: I can use AI to sort the right competitors, set a baseline for each channel, flag videos that beat that baseline, and trace those wins back to CTR, watch time, retention, engagement, traffic sources, titles, thumbnails, and hooks.
Here’s the short version:
- I group channels into direct, indirect, and aspirational competitors
- I log baseline data like subscriber count, upload pace, format mix, median views, and engagement
- I look for outliers with view multipliers such as 2× for a solid outlier and 10×+ for a major one
- I compare ratios, not just raw view counts
- I split Shorts and long-form instead of mixing them
- I study what moved the result: title formula, thumbnail pattern, hook type, and traffic source mix
- I turn those findings into a simple weekly and monthly review process
A few benchmark points stand out: 8%+ CTR is often a strong sign for packaging, and 50%+ retention of video length often shows the video is holding attention well. The article also stresses one key rule: one metric alone can mislead me. A video can get high views from outside traffic and still tell me little about what I should test on my own channel.
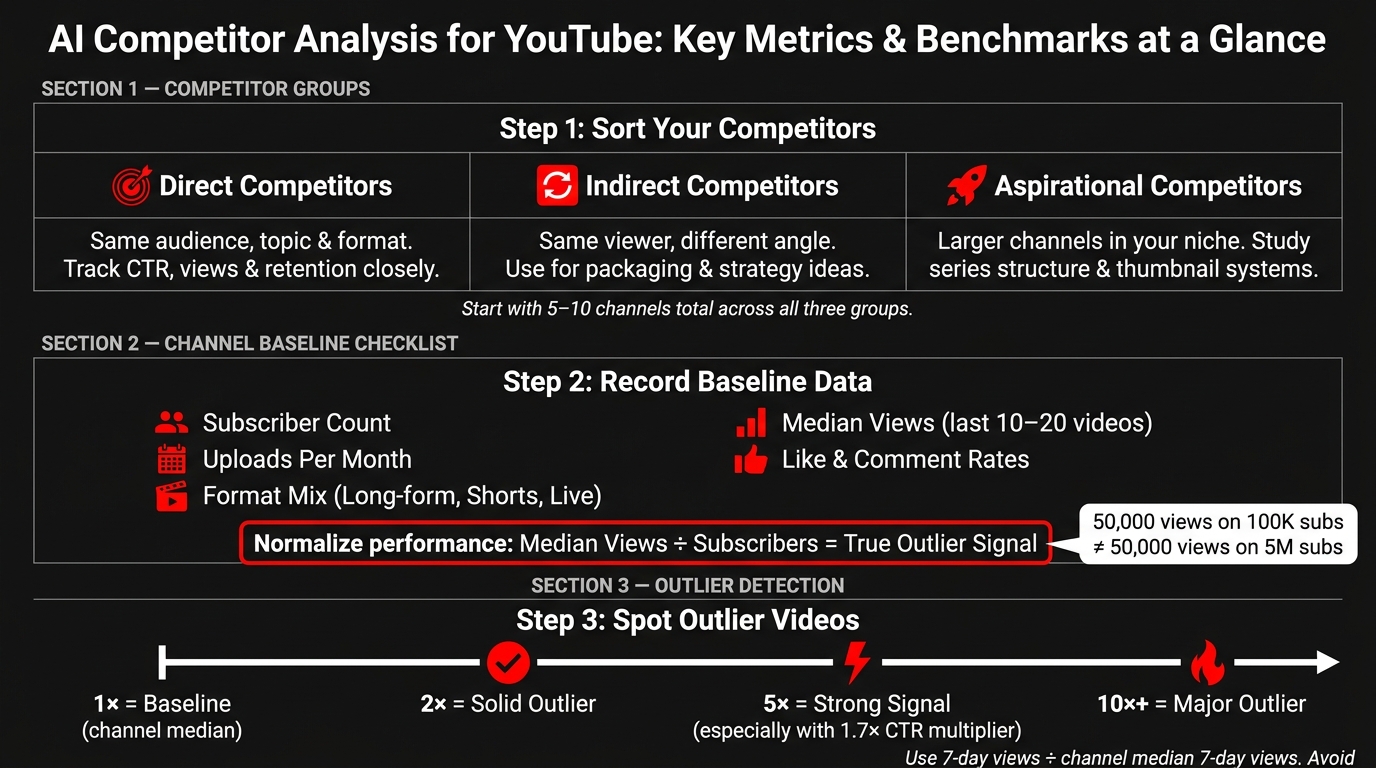
AI Competitor Analysis for YouTube: Key Metrics & Benchmarks at a Glance
Quick Comparison
| Area | What I check | What I’m trying to learn |
|---|---|---|
| Competitor groups | Direct, indirect, aspirational | Who I should compare closely |
| Channel baseline | Subscribers, uploads, median views, formats | What “normal” looks like |
| Outlier scan | 7-day view multiplier, CTR benchmarks multiplier | Which videos beat the norm |
| Core metrics | Views, CTR, watch time, AVD, retention, engagement, traffic sources | Why a video worked |
| Packaging | Titles and thumbnails | Why people clicked |
| Opening hook | First few seconds | Why people kept watching |
| Review process | Weekly and monthly checks | Which patterns are worth testing |
Bottom line: I’m not trying to copy a viral video. I’m trying to find patterns that show up more than once, test them one at a time, using thumbnail A/B testing to validate your findings, and feed those tests into my content plan.
sbb-itb-b59debf
Choose Competitors and Build a Baseline
Start with a curated competitor list. If you skip this step, AI tends to compare channels that are too different to tell you much.
Sort Channels Into Direct, Indirect, and Aspirational Competitors
Not every channel in your niche belongs in the same comparison group. Split competitors into three buckets so your analysis stays focused.
Direct competitors go after the same audience, cover similar topics, and use a similar format and posting pace. If you run a creator-tutorial channel, compare yourself to other tutorial channels first. These are the channels to track most closely for CTR, average views, and retention.
Indirect competitors reach the same viewer from another angle. That might include productivity, video editing, or YouTube growth channels that your audience also watches. They’re useful for packaging ideas and channel strategy, but not for head-to-head metric benchmarks.
Aspirational competitors are much larger channels in the same niche that you want to learn from. Look at their series structure, thumbnail systems, and posting patterns. Just don’t use their raw view counts as your target. Bigger channels play a different game, so those numbers don’t line up cleanly.
A good starting point is 5–10 channels total across all three buckets. You can add more later once AI tools make data collection easier.
Record Baseline Channel Data Before Comparing Videos
Once your list is set, record a baseline before you compare any videos. This is what makes AI analysis more accurate. Without it, you end up comparing raw view counts across channels with completely different audience sizes and posting frequency.
For each channel, track:
- Subscriber count
- Uploads per month
- Format mix such as long-form, Shorts, and live streams
- Median views from the last 10–20 videos
- Like and comment rates
Timestamp the sheet too.
Then normalize performance by dividing median views by subscribers. That small step matters a lot. A 50,000-view video means one thing on a 100,000-subscriber channel and something else entirely on a 5,000,000-subscriber channel. This ratio helps AI spot real outliers, meaning videos that beat a channel’s usual range, instead of just pushing the biggest channels to the top.
You should also log basic packaging details for each channel, like title length, thumbnail style, and recurring color schemes. Tools like ThumbnailCreator are much more useful when you already know which visual patterns are working inside your own competitor pool, or browse our YouTube thumbnail guides for more data-driven examples.
With that baseline in place, AI can flag videos that perform above each channel’s normal range.
Find Outlier Videos With AI
Once you have a baseline, AI can point out the videos that beat it. That’s where the useful clues usually are.
Measure Videos Against Each Channel's Normal Baseline
Skip “Most Popular.” It reflects total lifetime views, not actual outliers.
A better move is to compare each video to its own channel’s median, not to other channels. AI tools do this with a view multiplier: a video’s 7-day views divided by the channel’s median 7-day views. Using the median helps avoid skew from older viral hits.
Here’s the rough read:
- 2× usually means a solid outlier
- 10× or more points to a major outlier
From there, AI can label each outlier by title, thumbnail, topic, length, timing, and early engagement. If you want cleaner signals, don’t rely on views alone. Use more than one threshold. For example, a competitor video with a 5× view multiplier and about a 1.7× CTR multiplier is a much stronger sign than views by themselves.
After you flag the outliers, check one thing: does the pattern repeat, or did the video just pop once?
Tell Repeatable Wins Apart From One-Off Spikes
Traffic sources help sort durable wins from short-lived spikes.
Not every outlier points to something you can copy. Some jump because of trends, collabs, or paid promotion. The repeatable ones tend to keep pulling traffic from Browse, Suggested, and Search. One-off spikes often lean on External traffic.
That matters because the goal isn’t to chase random viral moments. The goal is to spot patterns you can test on your own channel. If a win shows up more than once, it’s worth your attention.
Once the outliers are clear, the next step is to identify which metrics explain the win.
Track the Metrics That Explain Performance
Metrics tell you why the outlier won. And they work best as a set. One number alone won't explain performance.
That's the key idea here: these signals help you tell the difference between a lucky spike and a pattern that keeps showing up.
Use Views, CTR, Watch Time, Retention, Engagement, and Traffic Sources
It helps to group them into four buckets: reach, packaging, content quality, and distribution.
| Metric | What It Shows | Why It Matters for Competitor Analysis |
|---|---|---|
| Views | Total view count | Shows scale, but not why a video performed |
| Impressions CTR | How often viewers click after seeing the thumbnail/title | Reveals whether a competitor's packaging is pulling attention or suffering from thumbnail mistakes |
| Watch Time | Total minutes watched across all viewers | Shows how much total attention a video earns |
| Average View Duration (AVD) | Average time watched per viewer | Shows how well the video holds attention after the click |
| Audience Retention | Where viewers keep watching or drop off | Exposes hook strength and structural weak points |
| Engagement | Likes, comments, shares, subscribers gained | Shows whether viewers reacted, not just whether they stayed |
| Traffic Sources | Search, Browse, Suggested, External, Shorts feed | Reveals how viewers found the video and which discovery path is driving performance |
CTR is often the first sign that packaging is working. Retention tells you whether the video pays off after the click.
CTR benchmarks vary, but 8%+ is usually strong. For retention, 50% or more of video length is a solid sign that the content is holding attention well enough to support more recommendations.
Traffic sources add one more layer. High Search traffic usually means a competitor is winning on intent-driven topics. A strong Browse and Suggested share means the platform is pushing the video to more viewers. Heavy External traffic often points to off-platform promotion instead of organic discovery.
Once you know which metric moved, you can start tracing it back to the cause, like the title, advanced thumbnail optimization, or opening hook.
Compare Metrics in Context, Not in Isolation
Raw numbers can fool you. A competitor with high views and weak retention didn't automatically do a better job than a smaller channel with fewer views and stronger retention. The smaller channel may have a tighter model, a better-matched topic, stronger pacing, or a closer fit with its audience.
When you're comparing channels of different sizes, focus on ratios and percentages instead of totals. That usually gives you a cleaner read. The main ones to watch are:
- CTR
- Retention rate
- AVD
- Engagement rate (likes + comments + shares per view)
Those numbers make cross-channel comparisons more useful.
One split matters a lot: don't compare Shorts and long-form side by side on AVD or retention. Shorts are shorter by nature, and people find them through different viewing patterns. So the numbers don't sit on the same scale. Review each format on its own, then look for format-level patterns in CTR, retention, and traffic source mix.
Mix the two together, and it's easy to end up with the wrong read on which format, or which competitor, is ahead.
Next, use those metric patterns to break down titles, thumbnails, and hooks.
Analyze Titles, Thumbnails, and Hooks
Use the outlier videos you already flagged to figure out why they worked. In most cases, the answer shows up in the title, the thumbnail, or the first few seconds. Start with the outliers that beat your baseline, not every single upload.
CTR tells you a lot about packaging. Retention tells you how strong the hook is. And both usually lead back to the same three pieces: the title, the thumbnail, and the opening seconds.
Break Down Title Formulas and Thumbnail Patterns
AI can scan competitor titles and label each one by formula type. Common patterns include curiosity gaps, clear outcomes, comparisons, warnings, speed claims, and problem-solution framing. Once those are tagged, you can compare each formula against CTR and views to spot which ones keep winning in your niche.
Thumbnail analysis follows the same idea. The main traits to measure are color contrast, on-image text length, face presence, face size and expression, clean composition, object emphasis, and how closely the image matches the title. The best thumbnails often share a few simple traits: strong contrast against YouTube’s interface, one clear focal point, and no more than 2–5 short words on the image.
| Element | What AI Measures | What to Look For |
|---|---|---|
| Title formula | Curiosity, outcome, comparison, warning, speed, problem-solution | Which formula type lines up with above-average CTR in your niche |
| Title structure | Character count, keyphrase, numbers, emotional modifiers | Many strong titles fall between 40–70 characters; numbers and emotional words sharpen the promise. |
| Thumbnail text | Word count, character count, placement | Use 2–5 short words that add to the title, not repeat it. |
| Face usage | Presence, size, emotional expression | Expressive faces with clear eye direction often lift CTR, especially in education and commentary. |
| Color contrast | Background vs. foreground contrast ratio | High-contrast thumbnails stand out against both light and dark YouTube UI |
| Title–thumbnail alignment | Semantic overlap between title text and thumbnail imagery | Misalignment can lift CTR but hurt retention when the video fails the promise. |
Review Opening Hooks and Packaging Alignment
The title and thumbnail make a promise. The opening seconds need to pay it off. If the packaging says one thing and the intro delivers another, people click, then bail early. That can drag down watch time.
AI can judge hook quality by transcribing the opening seconds and checking whether the main promise from the title shows up fast. It can also sort hooks by type. Common patterns include fast payoff - showing the result or tool on screen within 10 seconds; bold claim validation - repeating a strong promise and showing proof right away, like analytics screenshots; visual proof - live demos or side-by-side comparisons; and immediate stakes - making it clear what the viewer could gain or lose before the video moves on.
Log the main hook pattern, then turn your best thumbnail signals into drafts with ThumbnailCreator. If AI spots patterns like short thumbnail text, one expressive face, and one strong visual symbol, ThumbnailCreator’s templates, face swapping, text editing, and object swapping tools make it easy to build and test several thumbnail directions fast, without needing a designer. From there, group the strongest patterns and turn them into a weekly review habit.
Turn AI Findings Into a Repeatable Plan
The strongest outlier patterns should end up as a short test list. Competitor data only starts to matter when you turn it into something you can test.
Group Patterns and Rank the Strongest Opportunities
Sort what you find into repeatable buckets: topic, format, title angle, thumbnail strategies from top creators, hook type, and publish timing. That gives you a cleaner way to spot combinations that keep showing up across competitors. Then rank each pattern by the main metric it’s most likely to move: CTR, retention, or watch time.
Rank patterns using three factors:
- Repeatability: shows up in multiple outliers, not just one random spike
- Effort: a quick packaging change vs. a full format shift
- Upside: expected lift in CTR, retention, or watch time
From there, turn your top patterns into specific hypotheses tied to upcoming uploads. For instance, you might test whether shorter titles with a clear outcome beat broader evergreen titles. Or whether problem-first hooks keep viewers watching past the first 30 seconds. Stick to one major variable at a time so you can see what moved the result.
Build a Weekly or Monthly Competitor Review Process
Use that ranked list to review new uploads each week. This doesn’t have to eat up your calendar. A weekly review can take less than an hour. Scan new uploads, flag outliers, and note what changed in the title, thumbnail, and hook. You can even use AI thumbnail generation to quickly iterate on these findings. Then, before you script your next video, write down one to three test ideas based on the strongest pattern that repeated.
Your monthly review is where you separate a real pattern from a one-off. Look at which patterns repeated most during the month, cut ideas that stopped working, and check whether your own tests changed the numbers. Recheck direct, indirect, and aspirational competitors each month too. Niche lines shift, and what counts as a competitor can change fast.
FAQs
How many channels should I track first?
Start with 3–5 channels. Aim for ones that show up often for your target keywords and are close to your channel size.
If you want a broader quick audit, track 5–7 channels. Then, as your spreadsheet fills up and you start to spot more steady CTR and thumbnail patterns, you can expand to 5–10.
What if I can’t see a competitor’s CTR or retention?
You can’t directly see a competitor’s internal analytics, like CTR or retention, because those numbers aren’t public. So instead of guessing, look at public patterns and build your own baseline.
Use competitor-tracking tools to spot trends and compare engagement signals. You can also review public clues like like-to-view and comment-to-view ratios. Just don’t treat competitor data as proof. It’s context.
What matters most is how your audience responds. That’s why it makes sense to test your own designs with ThumbnailCreator and see what actually gets clicks.
How long should I test one change before judging results?
For A/B testing, run each change for 7 to 14 days. If your video gets fewer than 10,000 impressions per week, extend the test to 1 month.
Don’t judge the results too soon. Give it at least 24 to 48 hours before you make an early call. As a baseline, aim for 1,000 impressions per variant. If you want a clearer read, try to get 2,000 to 5,000 impressions per variant.
And when you review performance, don’t look at click-through rate alone. Check click-through rate and average view duration together. A thumbnail or title might get more clicks, but if people leave fast, that change may not help much.