
ROI Tracking for AI Thumbnails Simplified
Want to boost your YouTube performance while cutting costs? Tracking the ROI of AI-generated thumbnails is the key. Here's what you need to know:
- Why it matters: Thumbnails directly impact click-through rates (CTR) and watch time, which influence YouTube's algorithm. Even a 1–2% CTR increase can lead to thousands of extra views and higher ad revenue.
- Set clear goals: Focus on measurable metrics like CTR, Average View Duration (AVD), and impressions. Establish a baseline before testing AI thumbnails.
- Track costs: Compare the low cost of AI tools ($5–$50 per thumbnail) to AI thumbnails vs manual design costs ($500–$5,000).
- A/B testing: Use YouTube's "Test and Compare" feature to evaluate AI thumbnails against your current ones. Monitor performance metrics like CTR and AVD to identify winners.
- ROI formula: Calculate ROI by comparing increased revenue (from better CTR) against AI tool costs.
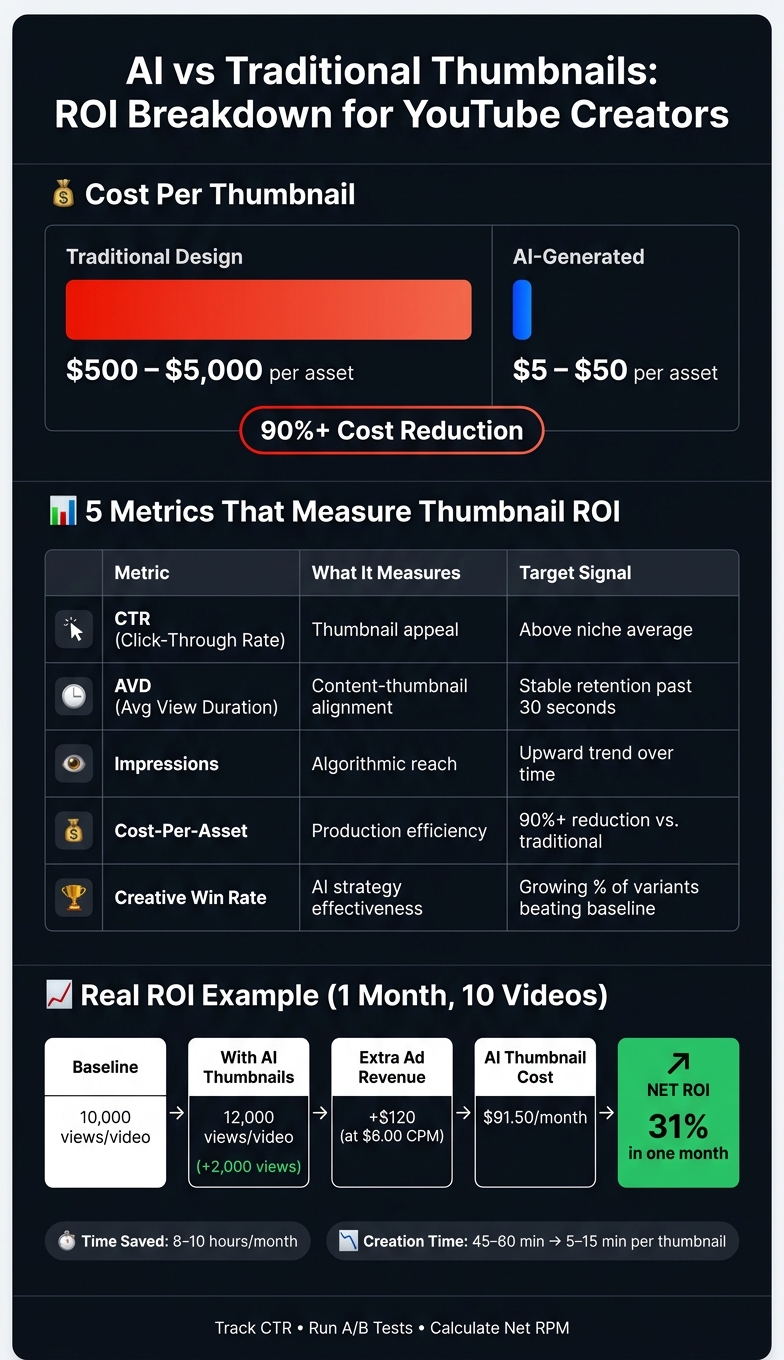
Example: If AI thumbnails boost views from 10,000 to 12,000 per video, earning an extra $120 in ad revenue (at $6 CPM), and cost $91.50 to create, that's a 31% ROI in one month.
Tracking ROI isn't just about more views - it helps streamline your workflow, save time, and identify what resonates with your audience. Start small, measure results, and refine your strategy for long-term growth.
This AI Analyzed My Videos and Generated Better Thumbnails
sbb-itb-b59debf
Set Clear Goals and Establish a Performance Baseline
Before diving into thumbnail changes, it’s crucial to define your goals and understand your current performance. Without this groundwork, you won’t be able to measure how AI-generated thumbnails are impacting your results.
Define Measurable Objectives
Vague goals like “get more views” won’t cut it. You need to tie your objectives to measurable metrics. CTR (Click-Through Rate) is the primary metric to focus on - it tells you how effective your thumbnail is at grabbing attention. Pair this with AVD (Average View Duration) to ensure that the clicks you’re getting translate into engaged viewers.
"A video with a 10% CTR followed by 80% of viewers leaving in the first 30 seconds is algorithmically worse than a 5% CTR where viewers watch 60% of the video." - Hooksnap Blog
In addition to engagement, think about cost efficiency. Start by calculating your current spend per thumbnail. Traditional designs can cost anywhere from $500 to $5,000 per asset, while AI-generated thumbnails typically cost between $5 and $50. This massive cost difference can create ROI even before factoring in performance improvements.
Once your objectives are clear, you’ll need baseline data to measure any changes.
Collect Baseline Performance Data
To establish a performance baseline, analyze your current metrics. Track CTR, impressions, AVD, and revenue per video. These numbers will serve as your reference point for evaluating the success of AI thumbnails.
It’s important to dig deeper than just one overall “average CTR” figure. Segment your CTR by traffic source to get a more complete picture. For example:
- Search traffic often yields 8–15% CTR.
- Suggested Videos tend to deliver 5–10%.
- Browse Features (Homepage) typically result in 3.5–7% CTR.
Leverage tools like YouTube Studio’s Ask Studio AI to uncover patterns. For instance, you can ask questions like, “Which of my last 10 videos had the highest watch time share?” to reveal insights you might otherwise overlook.
Connect AI Thumbnail Use to Key Metrics
Clear goals and baseline metrics are essential for tracking ROI. Once you have this foundation, map out which metrics AI thumbnails are likely to influence. For instance, faster and more visually appealing thumbnails should boost CTR. If your AVD remains steady or improves, it signals that the thumbnails align well with the content.
"The winning thumbnail is no longer the most clickable one. It is the one that sets the most accurate expectation." - Hooksnap Blog
Another key metric to monitor is your Creative Win Rate - the percentage of AI-generated thumbnails that outperform your baseline CTR. Over time, this metric will show whether your AI-driven design process is improving. Tools like ThumbnailCreator can help you quickly generate multiple thumbnail variants, making it easier to collect enough data for meaningful analysis at scale.
Here’s a quick breakdown of the key metrics to track:
| Metric | What It Measures | Target Signal |
|---|---|---|
| CTR | Thumbnail appeal | Above your niche average |
| AVD | Content-thumbnail alignment | Stable retention past 30 seconds |
| Impressions | Algorithmic reach | Upward trend over time |
| Cost-Per-Asset | Production efficiency | 90%+ reduction vs. traditional design |
| Creative Win Rate | AI strategy effectiveness | Growing % of variants beating baseline |
Track Key Metrics and Costs for AI Thumbnails
AI vs Traditional Thumbnails: ROI Breakdown for YouTube Creators
Identify and Monitor Core Metrics
Once you establish a baseline, focus on three key metrics to evaluate your thumbnail performance: impressions, CTR (click-through rate), and AVD (average view duration). Each metric tells a different part of the story. Impressions reveal how often your video is shown, CTR measures how often viewers click on your video, and AVD shows how long they stay engaged.
For context, the average CTR for most creators falls between 4% and 5%. However, this number varies depending on the traffic source. For example, YouTube Search often delivers CTRs of 8–15%, Suggested Videos typically range from 5–10%, and Browse Features hover around 3.5–4.5%. Instead of relying on a general average, always compare your CTR to the specific traffic source.
"Your analytics dashboard is actually a diagnostic tool - one that tells you exactly which thumbnails need fixing and why they're underperforming." - Dan Kim, Founder, Hooksnap
It’s also important to analyze what happens after someone clicks. If your CTR increases but your AVD drops significantly - especially if more than 40% of viewers leave within the first 30 seconds - it could mean your thumbnail is promising something the video doesn’t deliver. This mismatch might send negative signals to YouTube’s algorithm, potentially limiting your video's reach.
Calculate Derived Metrics
While core metrics give you the basics, derived metrics dig deeper into your thumbnail’s impact. Here are three derived KPIs worth tracking:
- Views per Impression: Measures how effectively impressions translate into views.
- Watch Time per View: Indicates whether your thumbnail aligns with the actual content and keeps viewers engaged.
- Revenue per View: Links thumbnail performance directly to revenue by factoring in your RPM (revenue per mille).
As Calqro Finance explains, "A thumbnail is the first variable a viewer judges, and even a 1–2% lift in click-through rates can translate into thousands of additional views and meaningful ad revenue gains".
By combining these deeper insights with advanced thumbnail optimization strategies, you’ll have a clearer picture of how thumbnails contribute to your channel’s success.
Track Costs Associated with AI Thumbnails
Understanding performance is only half the equation - you also need to track the costs of creating AI-generated thumbnails. ROI becomes meaningful when you weigh these expenses against your gains. Common costs include AI tool subscriptions and the time spent creating and refining thumbnails.
To keep things organized, use a spreadsheet to log monthly expenses. Track subscription fees and estimate the time spent on tasks like prompting, reviewing, and choosing thumbnail variants. Even small time investments - like 10–15 minutes per thumbnail - add up and should be accounted for.
Once you have a monthly cost total, you can calculate a break-even CTR target. This figure represents the minimum CTR improvement required to cover your AI tool costs through increased ad revenue. By tracking costs alongside performance, you’ll turn your data into actionable insights for smarter decision-making.
A Framework for Measuring ROI
This framework is designed to seamlessly fit into your overall strategy, helping you track ROI effectively. The key is to use controlled thumbnail experiments. Start by keeping your original, non-AI thumbnail as Thumbnail A - this serves as your control group and performance benchmark. Then introduce your AI-generated version as Thumbnail B, ensuring that all other elements - title, description, tags, and publish time - remain identical. This setup ensures that any changes in click-through rate (CTR) can be directly attributed to the thumbnail itself. An increase in CTR could lead to a 10–20% algorithmic boost, so factor this into your projections to avoid underestimating the potential impact of an improved thumbnail. To confirm these results, use A/B testing vs gut feeling to validate your findings.
Run A/B Tests for Thumbnails
YouTube's "Test and Compare" feature is an excellent tool for running A/B tests on thumbnails. Unlike manual swaps - where you alternate thumbnails over time - this feature shows different thumbnail versions to separate audience segments simultaneously. This method eliminates any time-of-day bias, giving you cleaner, more reliable results.
Consider trying the Safe-Safe-Wildcard method. This involves using one standard manual thumbnail, one slight variation of it, and one AI-generated "wildcard" concept. This approach safeguards your baseline performance while giving the AI-generated thumbnail a fair chance to demonstrate its effectiveness. To ensure your data is reliable, allow each variant to gather between 1,000 and 5,000 impressions before drawing conclusions. Also, avoid ending tests too early - give them at least 24–48 hours, as early subscriber behavior may not reflect the broader audience's preferences.
"YouTube favors combinations that get viewers to click AND keep them watching." - Influencer Marketing Hub
Keep in mind that YouTube ultimately prioritizes watch time share over raw CTR. A thumbnail with a slightly lower CTR can still outperform another if it attracts viewers who stay engaged longer. After the tests confirm a higher-performing thumbnail, you can measure the incremental gains to calculate ROI.
Calculate ROI Using Incremental Gains
Once your test data is in, calculating ROI is straightforward. Start by determining your Gross Revenue Lift using the formula:
((AI Views − Base Views) / 1,000) × Net RPM.
Next, subtract your AI costs to find your Net Profit. Finally, compute ROI with the formula:
(Net Profit / AI Cost) × 100.
Use your Net RPM (found in the Revenue tab of YouTube Studio) for these calculations. This value reflects your actual earnings after YouTube's cut, ensuring your ROI projections are based on real take-home numbers. Even small boosts in CTR can lead to noticeable revenue increases. For instance, if your AI tool costs $25, it can quickly pay for itself if your channel generates a healthy number of impressions. Running a break-even analysis before launching a test can help you set realistic CTR goals and determine when your AI thumbnails have transitioned from being a cost to becoming a profit driver.
Use Data to Refine Your Strategy and Build a Simple Dashboard
Once you’ve gathered ROI data from controlled thumbnail experiments, it’s time to turn those insights into action. Numbers alone won’t improve your strategy - how you use them will.
Build a Simple ROI Dashboard
Start by creating a spreadsheet to track key metrics for each video. Include details like the video title, publish date, thumbnail type (AI-generated or manual), impressions, segmented CTR (click-through rate), average view duration (AVD), and calculated ROI. Break down CTR by traffic source to avoid skewed aggregate data. To dig deeper, log design elements like face size, color palette, word count, and background style alongside performance metrics. This approach will help you pinpoint what resonates with your audience.
Update your dashboard weekly to stay on top of YouTube thumbnail trends. For example:
- Monday: Review overall metrics.
- Wednesday: Dive into traffic source details.
- Friday: Launch new thumbnail variants.
This consistent routine transforms raw data into actionable insights, helping you spot patterns and fine-tune your designs.
Analyze Trends and Spot What Works
To maximize impact, focus on videos with high impressions but low CTR. These videos are already benefiting from algorithmic reach but aren’t converting views. They’re your priority candidates for a thumbnail refresh since the hard part - distribution - has already been handled. Targeting the top 20% of videos by impressions can drive nearly 78% of your channel’s performance improvements.
Be mindful of the natural CTR dip that comes with broader reach. Also, compare CTR to AVD. If CTR improves but viewers drop off quickly, it’s a sign the thumbnail might be overpromising - or misaligned with the video content. This mismatch, often called a "viewer contract" issue, can hurt your rankings over time.
"A data-driven thumbnail iteration system that logs design elements against CTR outcomes compounds small improvements into major performance gains over three to six months." - TubeAI Learn
Adjust Your Thumbnail and Testing Strategy
Use these insights to refine your approach. Keep design elements that perform well - like a specific color scheme or facial expression - and use them as the foundation for your next round of AI-generated thumbnails. This iterative testing process has been shown to boost CTR by 150–200% over several cycles. Tools like ThumbnailCreator simplify the process, allowing you to quickly create new variants based on what’s already working.
When addressing underperforming thumbnails, let the traffic source guide your changes:
- Low Browse CTR: This often points to weak visual contrast or a lack of emotional appeal. Try increasing contrast and limiting text to three words or fewer.
- Low Search CTR: This suggests the thumbnail doesn’t align with the viewer’s search intent. Ensure it visually represents the query’s subject.
Conclusion: Start Tracking ROI for AI Thumbnails Today
Tracking the ROI of AI-generated thumbnails doesn’t have to be complicated. All you need is a clear plan: set numeric goals, measure your baseline performance, compare AI thumbnails to past results, and fine-tune your strategy. This method not only helps grow your revenue but also streamlines your content creation process.
Let’s break it down with an example of the potential benefits. Imagine a creator uploading 10 videos a month and using AI thumbnails. If these thumbnails boost average views from 10,000 to 12,000 per video, that’s an extra $120 in ad revenue (based on a $6.00 CPM). With thumbnail costs around $91.50 (including tool subscription and time), this translates to a 31% ROI in just one month. And that’s not even counting the added perks like subscriber growth and long-term algorithmic advantages.
Time savings are another big win. Tools like ThumbnailCreator can reduce thumbnail creation time from 45–60 minutes to just 5–15 minutes. Over 12 videos a month, that’s 8–10 hours saved - time you can reinvest into scripting, editing, or other creative tasks.
To get started, set up a simple spreadsheet to track key metrics: publish date, thumbnail type, impressions, CTR, views, and estimated revenue. Spending just 30 minutes each week reviewing this data can help you identify trends and refine your approach. Over 60–90 days, you’ll gain valuable insights into what resonates with your audience, allowing you to make smarter, data-backed design decisions that fuel long-term channel growth.
FAQs
How long should I run a thumbnail A/B test before picking a winner?
To get accurate results from your thumbnail A/B test, aim to run it for 5 to 14 days. This time frame ensures you capture both weekday and weekend traffic patterns, which can vary significantly.
Make sure each thumbnail variant receives at least 1,000 to 2,000 impressions. This gives you enough data to draw statistically reliable conclusions. Resist the urge to end the test early - even if one thumbnail seems to be performing better. Cutting the test short can skew your results.
Lastly, avoid making changes to other video elements, like titles or descriptions, during the test. Altering these can interfere with the experiment and make it harder to pinpoint what’s driving any changes in performance.
How do I calculate ROI if my RPM changes week to week?
To figure out ROI when dealing with fluctuating RPM, it's best to look at a longer time frame, such as a month or a quarter. You can either calculate a weighted average or simply divide the total revenue generated from impressions (thanks to your thumbnails) by the total production costs for that period. This method gives you a clearer picture of overall performance. Tools like ThumbnailCreator can boost your revenue potential by improving click-through rates, helping your strategy handle RPM changes more effectively.
What should I do if CTR goes up but watch time drops?
If your click-through rate (CTR) goes up but your watch time takes a hit, it’s a red flag that your thumbnail might be misleading. Overpromising content through your thumbnail creates a disconnect, which can harm how often your video gets recommended. To address this, make sure your thumbnail accurately reflects what’s in the video. Tools like ThumbnailCreator can help you design thumbnails that match your content. Additionally, aim to deliver value early - ideally within the first 30% of the video - to keep viewers interested and watching.