
How To Test Thumbnails For Better Retention
Thumbnail testing on YouTube isn’t just about getting clicks - it’s about keeping viewers engaged. Using YouTube’s "Test & Compare" tool, you can A/B test up to three thumbnail variations simultaneously. The platform evaluates performance based on watch time share, not just click-through rates (CTR). Here's the key takeaway: a thumbnail’s success depends on its ability to attract the right viewers and keep them watching.
Key Points:
- Retention is more important than CTR: High CTR with low retention reduces reach. YouTube rewards videos that hold attention.
- Watch Time Share is the metric to track: It combines impressions, CTR, and average view duration (AVD).
- Testing Process: Upload 2–3 thumbnail variations, let YouTube split-test them over 7–14 days, and analyze results.
- Set Goals: Focus on metrics like early retention and AVD to measure success.
- Design Variations: Test elements like text, colors, or facial expressions. Keep changes simple for clear results.
Quick Steps to Start:
- Use YouTube Studio’s Test & Compare tool.
- Run tests until each thumbnail gets at least 1,000 impressions.
- Analyze performance using watch time share and retention graphs.
- Apply insights to refine your thumbnail strategy.
By focusing on retention, you’ll improve video performance and grow your channel effectively. Let data-driven A/B testing guide your decisions, and remember: a great thumbnail delivers on its promise and keeps viewers engaged.
YouTube Thumbnail A/B Testing Process: From Setup to Strategy
How to Prepare for Thumbnail Tests
Define Your Retention Goals and Metrics
Start by deciding what you want to measure. YouTube's "Test & Compare" tool focuses on Watch Time Share instead of just Click-Through Rate (CTR) benchmarks. This ensures your thumbnail not only grabs attention but also keeps viewers engaged.
"YouTube does not optimize A/B tests for Click-Through Rate (CTR). It optimizes for 'Watch Time Share.'" - Edison
Here are the key metrics to track:
- Watch Time Share: This measures how much total watch time each thumbnail variation generates.
- Average View Duration: Tracks how long viewers stick around after clicking.
- Early Retention: Focuses on engagement within the first 30 seconds - a crucial window where misleading thumbnails often cause viewers to drop off.
You can find these metrics in YouTube Studio by navigating to Content, selecting your video, and going to Analytics > Reach. These numbers will help you create a focused hypothesis for your test.
Write a Retention-Focused Hypothesis
Once you’ve identified your retention metrics, craft a hypothesis that ties a specific design change to viewer behavior. Your hypothesis should aim to boost retention by addressing key elements of the thumbnail. For example, you might test variations like Face vs. No Face, Text-heavy vs. Minimal, or emphasize a Specific Outcome (e.g., "Grow to 10K Subs") versus a Pain Avoidance approach (e.g., "Stop Posting Videos No One Watches").
The goal is to attract viewers who are genuinely interested in your content. And don’t forget: the thumbnail’s promise should align with the video’s content within the first 5–10 seconds.
"A thumbnail's job is to get a qualified click. A video's job is to retain the viewer." - Edison
Create Thumbnail Variations for Testing
Based on your hypothesis, design a few distinct thumbnail variations to get meaningful results. Aim for three variations:
- Safe: Use your standard style as a baseline.
- Bold: Experiment with high-contrast colors and strong emotional cues.
- Wild Card: Try a completely different design concept.
To ensure accurate testing, change only one major element per variation - like text, facial expression, background, or color tone. This makes it easier to identify what’s driving performance.
Here are some technical tips to keep in mind:
- Export thumbnails at 1,280×720 pixels. Anything below 720p will be downscaled to 480p.
- Check thumbnail clarity on mobile devices, as over 60% of long-form views come from mobile users.
If you’re short on time, tools like ThumbnailCreator can help. They offer AI-powered features and professional templates, making it easy to create polished variations without starting from scratch.
sbb-itb-b59debf
How to Run A/B Tests on YouTube
Set Up a Test for a New Video
YouTube offers a handy Test & Compare tool that allows you to upload up to three thumbnail variations at once. To use this feature, you'll need to enable advanced channel settings on a desktop. Keep in mind, this tool doesn’t work for mobile uploads, Shorts, "Made for Kids" content, private videos, or age-restricted uploads.
Here’s how to get started: In YouTube Studio, navigate to the Thumbnail section of your video. Select Test & Compare, upload your thumbnail options, and let YouTube handle the distribution. The platform will track metrics like watch time share to determine performance.
"Great thumbnails don't just get viewers to click. They also help viewers understand what the video is about, so that they can make informed decisions about what to watch." - YouTube
This tool also works for refining thumbnails on videos you’ve already uploaded.
Run a Test on an Existing Video
To test thumbnails on a video that’s already live, go to the Content tab in YouTube Studio. Select the video you want to test and choose A/B testing in the Thumbnail section. Opt for "Thumbnail only" to focus solely on the visual element. This is especially effective for vlog thumbnails where personal connection is key.
The best candidates for testing are videos that already get 500–1,000 daily impressions but have a click-through rate below 5%. These videos are active enough to generate quick insights without waiting weeks for data. For instance, in August 2025, vidIQ conducted a Test & Compare experiment on an AI-related video by testing three different thumbnails. The winning thumbnail, featuring a simple robot image, captured 59.7% of the total watch time. Once applied permanently, the video’s view count nearly tripled.
Track Test Progress and Know When to Stop
Once your test is running, monitoring its progress is key. In the video's Analytics section under Reach, select Manage test to check how it’s performing. Most tests wrap up within a few days to two weeks.
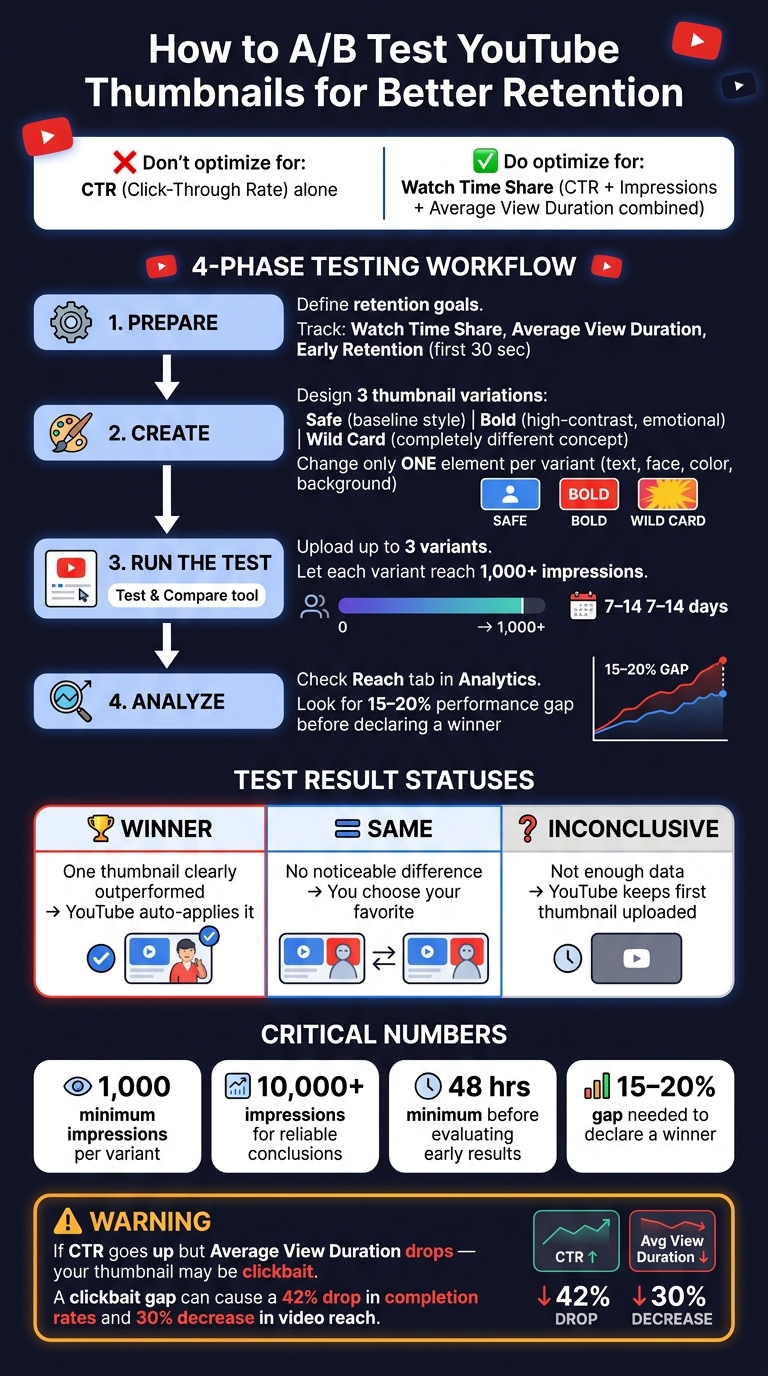
Avoid stopping your test too early - especially within the first 48 hours. Early results can be misleading. Let each thumbnail variant gather at least 1,000 impressions, and look for a performance gap of 15–20% before making any decisions. Watch time share is what you’re aiming to improve, as it reflects genuine viewer engagement.
When the test concludes, YouTube assigns one of three statuses:
| Status | What It Means |
|---|---|
| Winner | One thumbnail clearly outperformed the others. YouTube will automatically apply it. |
| Performed the same | No noticeable difference between thumbnails. You can pick your favorite. |
| Inconclusive | Not enough data to determine a winner. YouTube will stick with the first thumbnail uploaded. |
Keep in mind: If you manually change the title or thumbnail while the test is running, the test will stop immediately, and you’ll need to restart it.
How to Read Your Thumbnail Test Results
Read YouTube's A/B Test Reports
Once your test wraps up, it’s time to dig into the results using YouTube Studio Analytics. Head over to the Reach tab and click on Manage Test to access the data. As mentioned earlier, prioritize watch time share over CTR (Click-Through Rate). Why? A thumbnail that gets fewer clicks might still perform better if it keeps viewers engaged longer. For reliable results, each thumbnail variant should get at least 1,000–5,000 impressions, though conclusions are generally more dependable with 10,000+ total impressions.
Compare CTR and Retention Side by Side
Once you’ve reviewed the test data, take a closer look at the relationship between CTR and retention. Don’t just focus on CTR in isolation. For example, a thumbnail with an 8% CTR and a 3-minute average view duration (AVD) might outperform one with a 10% CTR but only a 2-minute AVD. Why? Because the first scenario delivers more overall watch time. On the flip side, if your CTR improves but AVD drops, it’s a red flag. This could mean the thumbnail is drawing clicks but misrepresenting the video by using clickbait. As the GrabThumbs Editorial Team explains, "If clicks go up but viewers leave faster, the thumbnail may have become more exciting and less accurate."
Spot Post-Click Behavior Patterns
Numbers tell part of the story, but visual analysis can reveal even more. Pay close attention to the retention graph, especially during the first 30 seconds of the video. A sharp drop-off in this period - even for the "winning" thumbnail - might signal a mismatch between the thumbnail’s promise and the video’s opening moments . This kind of “clickbait gap” can harm viewer satisfaction, leading to as much as a 42% drop in completion rates and a potential 30% decrease in video reach. On the other hand, a smooth, steady retention curve early on suggests your thumbnail is accurately setting expectations and keeping viewers engaged.
How to Scale and Refine Your Thumbnail Strategy
Build a Repeatable Testing Workflow
After identifying clear winners through individual tests, it's time to take things up a notch and make the process scalable. A single test doesn’t provide much long-term value unless you turn it into a repeatable system for every upload. Here’s a simple four-phase approach to streamline your workflow:
- Phase 1: Create 3–5 thumbnail concepts before uploading a video.
- Phase 2: Narrow those down to the top 2–3 options.
- Phase 3: Monitor performance during the first 24–48 hours after publishing.
- Phase 4: Run A/B tests over 7–14 days to capture viewing patterns across weekdays and weekends.
Keep a detailed log of every test you run. Document what you tested, the winning variant, and by how much it outperformed the others. This record will become a treasure trove of insights that you can refer to over time. Tools like ThumbnailCreator make this process faster and easier by providing professional templates. These templates let you create polished variants in minutes, without having to start from scratch each time. Following this structured approach makes it easier to scale improvements across your entire video library.
"The difference between good and great on YouTube is testing. Most creators upload and pray. Professionals upload and measure." - Derral Eves, YouTube Expert
Focus Tests Where They Have the Most Impact
Once you’ve got a workflow in place, focus your efforts on areas that can deliver the biggest results. Start with evergreen videos or those with high impressions but a lower-than-expected click-through rate (CTR). These are prime candidates for thumbnail refinements, as they allow you to boost performance without disrupting early momentum.
For new uploads, timing is everything. The first 48 hours are critical because that’s when YouTube’s recommendation system is most active. Having your thumbnail variants ready to go before you hit publish can make a big difference.
When analyzing test results, follow this rule of thumb: only make permanent changes when a winning thumbnail outperforms the other by at least 15–20%. Smaller differences are often just statistical noise and don’t warrant a redesign.
Convert Test Results Into Actionable Design Guidelines
Over time, patterns will start to emerge from your testing data. For example, you might find that close-ups of faces consistently outperform wider shots, or that bold, sans-serif fonts drive higher CTRs compared to decorative ones. These aren’t just hunches - they’re proven trends you can rely on.
Turn these insights into a "design bible" for your channel. This guide should include specific rules like "limit text to 3–5 words," "use contrasting colors for backgrounds," or "always include an expressive face as the focal point". Tools like ThumbnailCreator can help you stick to these standards by offering customizable templates. You can easily swap out elements like faces, text, or backgrounds while keeping your thumbnails consistent with your established guidelines. This not only saves time but also ensures every new thumbnail aligns with what works best for your audience.
YouTube A/B Thumbnail Testing EXPLAINED!
Conclusion
Thumbnail testing is a continuous process that builds valuable knowledge over time. Each test contributes to a deeper understanding of what resonates with your audience, and these insights accumulate across multiple videos.
The key takeaway is simple: a thumbnail's purpose isn't just to grab a click - it’s to attract the right click. A viewer who clicks and stays engaged is far more beneficial than one who clicks and quickly leaves. YouTube’s algorithm values these engaged viewers, and so should you.
To get started, define a clear hypothesis, create 2–3 targeted variations, and run your test for 3–14 days or until each version reaches 1,000 impressions. Let the data guide your decisions. For those managing multiple channels, testing thumbnails at scale requires a more systematic approach. Tools like ThumbnailCreator can make the design process faster, giving you more time to focus on analyzing the results. This efficient workflow aligns perfectly with the testing strategy discussed earlier.
"Thumbnail testing without parallel attention to audience retention is a half-finished discipline."
Even small improvements can lead to big results. For instance, a 2% increase in click-through rate (CTR) on a video with strong retention can significantly boost views through YouTube’s algorithm, helping your channel grow. Consistent, data-driven thumbnail testing is one of the most impactful habits a creator can develop. Every informed design choice brings you closer to avoiding common thumbnail mistakes and creating thumbnails that not only draw in viewers but keep them engaged.
FAQs
How can I tell if a thumbnail is hurting retention?
You can figure out if a thumbnail is impacting retention by diving into viewer engagement stats like watch time and retention rates. For example, if a thumbnail grabs clicks but results in short viewing times or early drop-offs, it might be working against you. To refine your approach, try A/B testing different thumbnails. Pay close attention to click-through rates, average view duration, and retention metrics to identify which designs boost overall performance.
How many impressions do I need for a reliable thumbnail test?
For a solid thumbnail test, try to hit at least 1,000 impressions per variation to collect useful data. If you're testing multiple thumbnails, aim for 5,000–10,000 total impressions across all variations to improve accuracy. Make sure to run the test for at least 7 days to factor in changes in viewer behavior throughout the week. Following these steps will help you get reliable results and minimize random fluctuations.
What should I change between thumbnail variants to get clear results?
To get accurate results when testing different thumbnail designs, focus on changing just one major element at a time. This could mean tweaking the presence of a face, background color, text size or color, or even the overall concept (like switching between a face and a product shot). Making multiple changes at once can muddy the waters, making it tough to pinpoint what actually influenced performance.
For reliable insights, ensure each thumbnail variant gets at least 1,000 impressions and let the test run for 3–7 days. This approach gives you clearer, actionable data.