

Top Tools for Tracking Thumbnail Performance Trends
If I want to track thumbnail performance the right way, I don’t look at one CTR spike and call it a win. I track impressions, impressions CTR, average view duration, and early retention across 7-day, 28-day, and 90-day windows to see whether a thumbnail still works as reach grows.
Here’s the short version:
- YouTube Studio is my main source for CTR, impressions, watch time, retention, and traffic source data.
- YouTube Test & Compare helps me test 2–3 thumbnail versions for up to 14 days using Watch Time Share.
- TubeBuddy helps me spot low-CTR videos and run browser-based tests.
- vidIQ helps me check how a thumbnail looks next to competing videos before publish.
- Google Sheets helps me log thumbnail versions, swap dates, CTR, AVD, and traffic source.
- Looker Studio helps me view 7-, 28-, and 90-day trends in one dashboard.
- ThumbnailCreator helps me make controlled variants so I can test one change at a time.
A few numbers matter most at the start:
- Wait 48–72 hours after a thumbnail update before judging it.
- Review each video at 7 days, 28 days, and 90 days.
- Use first-30-second retention as a fast check for click mismatch.
- Color-code logs like:
- Green: CTR above 8%
- Yellow: 4%–7%
- Red: below 3%
A/B Test YOUR YouTube Thumbnails For FREE! [A/B Testing Tutorial]
sbb-itb-b59debf
Quick Comparison
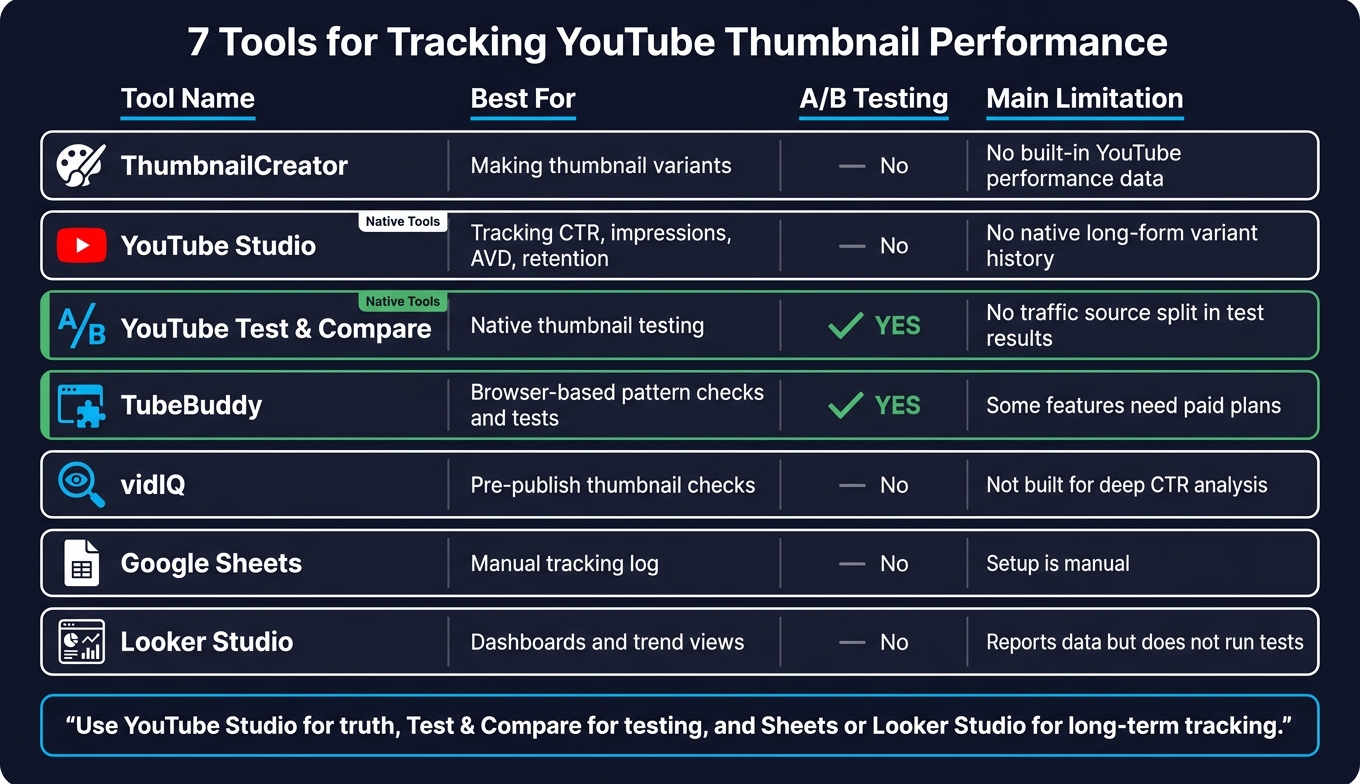
7 Best Tools for Tracking YouTube Thumbnail Performance (2024)
| Tool | Best for | A/B testing | Main limit |
|---|---|---|---|
| ThumbnailCreator | Making thumbnail variants | No | No built-in YouTube performance data |
| YouTube Studio | Tracking CTR, impressions, AVD, retention | No | No native long-form variant history |
| YouTube Test & Compare | Native thumbnail testing | Yes | No traffic source split in test results |
| TubeBuddy | Browser-based pattern checks and tests | Yes | Some features need paid plans |
| vidIQ | Pre-publish thumbnail checks | No | Not built for deep CTR analysis |
| Google Sheets | Manual tracking log | No | Setup is manual |
| Looker Studio | Dashboards and trend views | No | Reports data but does not run tests |
If I had to sum it up in one line: I use YouTube Studio for truth, check CTR benchmarks to see how you compare, Test & Compare for testing, and Sheets or Looker Studio for long-term tracking.
What Thumbnail Trends Actually Tell You
A strong CTR can look great at first, but that doesn't settle the question. Early clicks often come from your core audience, the people most likely to respond no matter what. The bigger test comes later: does that CTR hold when reach expands? And after the click, do retention and watch time show that the thumbnail brought in the right viewers?
Recurring CTR Patterns Across 7, 28, and 90 Days
Each time window tells a different story.
- The 7-day view shows how subscribers and early viewers react.
- The 28-day view shows whether CTR stays in shape as YouTube pushes the video to more people.
- The 90-day view shows whether that pattern keeps going over time.
If one thumbnail style stays steady across all three windows, that's the style worth repeating.
How Traffic Sources Affect Thumbnail Performance
The same thumbnail can land very differently based on where people see it. A design that earns strong clicks from YouTube Search may do poorly on the Home feed. That's normal. Search viewers often have intent. Home viewers are scrolling.
Suggested Videos is one traffic source to watch closely. If CTR is strong there, your thumbnail is doing its job in a crowded feed. In YouTube Studio, break CTR down by source so you can spot where the thumbnail works and where it starts to lose steam. That source-level view is the baseline the tools below should help you track.
Reading Performance Shifts After a Thumbnail Update
When deciding whether to update old thumbnails vs leaving them, don't judge a new design too fast. Give it 48–72 hours before you make the call.
Then compare these side by side:
- Impressions
- CTR
- Average view duration
CTR by itself can mislead you. Outside factors can throw the numbers off too. Holidays, product launches, and news spikes can all skew performance for reasons that have nothing to do with the design. Write those down as they happen so you're comparing cleaner data, not guessing after the fact.
Why CTR Alone Does Not Tell the Full Story
A high CTR can still hide a problem. If average view duration (AVD) drops hard after a thumbnail change, that's usually a sign the new design is pulling in viewers who expected something else. They click, realize the video isn't what they had in mind, and bounce.
Audience retention in the first 30 seconds is a fast gut check here. If you see a steep drop right after the intro, there's probably a mismatch between what the thumbnail promised and what the video delivered.
The best read comes from looking at CTR, average view duration, and first-30-second retention together. That's how you tell whether a thumbnail is just getting clicks or actually bringing in viewers who stay.
1. ThumbnailCreator
ThumbnailCreator is an AI-powered thumbnail tool built for YouTube creators. It helps you make controlled thumbnail variants, which means you can test one change at a time before moving into YouTube Studio.
That matters more than it may seem. If you change the facial expression, text hook, and background all at once, you can't tell which change moved CTR. ThumbnailCreator is built to stop that kind of guesswork.
Here’s how its features line up with specific testing variables:
- Face swapping - Test one emotion at a time.
- Text editing - Test one headline or hook.
- Object swapping - Test one focal object.
- Templates - Test layout and visual hierarchy.
After you build the variants, measure them inside YouTube’s analytics tools. Upload them to YouTube Studio’s Test & Compare feature to run the A/B test, then track CTR and impressions over 7, 28, and 90 days. From there, use YouTube Studio to see how each variant performs.
2. YouTube Studio Analytics
Use YouTube Studio when you want the clearest read on how thumbnail trends play out over time. YouTube Studio Analytics is your main data source for thumbnail performance. It pulls straight from YouTube’s own systems, so metrics like impressions, CTR, watch time, and retention are the most dependable reference point for analysis.
Start with the Reach tab. That’s where you’ll find the "Impressions and how they led to watch time" funnel. It shows the path from someone seeing your thumbnail to actually watching your video, and it makes drop-offs and conversions much easier to spot. From there, use the date filters to compare the same video across different time windows.
The 7-, 28-, and 90-day views help you see whether CTR stays steady as impressions grow and the video gets older. If CTR starts slipping over time, the thumbnail may be losing steam.
You should also filter by traffic source. That helps you see where the thumbnail keeps working and where CTR starts to dip. Then compare CTR with Average View Duration and retention to check whether those clicks turn into engaged viewing.
| Metric | Where to Find It | What It Tells You |
|---|---|---|
| Impressions CTR | Reach tab | Click rate after thumbnail views |
| Impressions | Reach tab | Reach context |
| Watch Time from Impressions | Reach tab funnel | Watch time generated from thumbnail exposure |
| Average View Duration | YouTube Studio analytics | Viewer engagement after the click |
| CTR by Traffic Source | Reach tab → filter by source | Where the thumbnail performs best |
Cost: Free with every YouTube channel.
3. YouTube Test & Compare
YouTube Test & Compare is YouTube’s native A/B testing tool, built right into YouTube Studio. You can upload two or three thumbnail versions and let YouTube split-test them for you. It’s a good fit when you need a short-term winner before locking in a thumbnail for longer-term trend tracking.
Why does this matter? Because clicks alone don’t tell the whole story. A thumbnail might get the click and still bring in the wrong viewer. Unlike manual thumbnail swaps, Test & Compare ranks variants by Watch Time Share, not just clicks. So the winning thumbnail isn’t simply the one that gets attention. It’s the one that gets people to keep watching.
That ties straight into the main point here: the best thumbnail is the one that earns the click and holds attention.
You can run tests for up to 14 days, or until YouTube finds a clear winner. After that, track the winner in Studio.
There are two limits worth knowing. Test & Compare does not break results down by traffic source. It also does not include losing variants in long-term Reach reports. So before the test ends, log each variant’s CTR and Watch Time Share. Save those results, then use them as baseline data in your tracking workflow.
| Feature | Detail |
|---|---|
| Test length | Up to 14 days |
| Primary metric | Watch Time Share |
| Traffic source breakdown | No |
| Long-term trend tracking | No |
Cost: Free for creators with Advanced Features access.
4. TubeBuddy
If you want to spot patterns without leaving the browser, TubeBuddy adds a handy layer on top of YouTube Studio. It highlights thumbnail patterns right inside the interface, so you can see which designs get clicks and which ones are thumbnail mistakes to avoid.
The standout tool here is Click Magnet. It groups your videos into high-performing and low-performing thumbnails, which makes style trends much easier to spot. You can quickly see what your audience responds to. It also flags videos with strong retention but weak CTR, so you know where a thumbnail refresh could pay off.
TubeBuddy also includes an A/B testing tool on the Legend plan. It rotates two thumbnail versions and tracks performance until it reaches statistical significance. A simple way to use it: run Click Magnet each month, write down the visual traits that show up in your top thumbnails, and test those ideas on new uploads. Then use those notes to pick which older thumbnails are worth retesting.
| Feature | What It Does | Plan Required |
|---|---|---|
| Click Magnet | Sorts videos by CTR and watch time; flags high-impression, low-CTR videos | Legend |
| A/B Testing | Tests two thumbnail variants and identifies the statistically stronger version | Legend |
| CTR Opportunities | Surfaces videos with strong retention but weak CTR | Legend |
| Health Report | Summarizes channel trends across 7, 28, and 90 days | Pro / Legend |
5. vidIQ
vidIQ is a research and preview tool, not a deep analytics source. Use it to spot thumbnail patterns across your niche before you publish. That makes it handy for pre-publish checks, then you can confirm what happened later in YouTube Studio.
The big draw here is Thumbnail Preview. It shows your thumbnail next to competing videos in search, so you can catch issues with text, faces, and timestamps before the video goes live. That’s useful because a thumbnail can look fine on its own and still fall flat once it sits beside five others.
A bump in views per hour after a thumbnail change can act as an early momentum signal. But there’s a catch: metric updates can lag behind YouTube Studio, and vidIQ doesn’t break down CTR by traffic source. So treat those signals like a first pass. They can help you decide which thumbnail ideas are worth a deeper Studio readout or compare thumbnail tools to refine your workflow.
Here’s the fastest way to use vidIQ for trend spotting:
| Feature | Best Use | Limitation |
|---|---|---|
| Thumbnail Preview | Check design against competitors before publishing | No performance data attached |
| Views Per Hour (VPH) | Spot early momentum after a thumbnail change | Not a substitute for CTR trend analysis |
| Competitor Tracking | Identify visual patterns working in your niche | No built-in split-testing engine |
6. Google Sheets
Use Google Sheets to track and compare thumbnail performance over time. It works as your running record of what changed, when it changed, and why it mattered.
Start with a master log built from YouTube Studio exports. Each row should include the video, date range, thumbnail version, CTR, impressions, and traffic source. That setup makes trend shifts much easier to spot.
Add a Thumbnail Version column with labels like V1_Red_Text or V2_Face_Only. This gives you a clean way to see which design change moved CTR.
Google Sheets is also handy for quick visual checks. Use:
- Green for CTR above 8%
- Yellow for 4%–7%
- Red for below 3%
With conditional formatting in place, you can scan your channel data and spot patterns fast. Pivot tables help too. Group by thumbnail version or style to find repeat winners.
It also helps to run a simple CTR-to-AVD check. A high CTR with weak AVD can point to a thumbnail-content mismatch that hurts retention. That same log can then feed the dashboard reporting in the next tool.
7. Looker Studio

Looker Studio turns YouTube Analytics and Google Sheets data into dashboards that help you track thumbnail performance over time. It's free to use, and you can connect it through the YouTube Analytics connector.
Once it's set up, you can build dashboards for metrics like:
- Impressions
- CTR
- Views
- Watch time
- Traffic source
The big win here is time-based comparison. You can use date-range controls to compare 7-, 28-, and 90-day CTR trends side by side. That makes it much easier to spot patterns instead of guessing from a single snapshot.
Line charts can show how CTR moves after you swap a thumbnail. Bar charts can compare thumbnail versions. Scorecards give you a fast read on current CTR when you just want the headline number.
If you import thumbnail version labels and change dates, you can also compare before-and-after CTR, impressions, and watch time in one report. In plain English: you get one place to scan how thumbnail changes affected multiple uploads.
One thing to be clear about: Looker Studio reports results. It doesn't test thumbnails at scale. So your setup matters a lot. Use clean version labels, stick to consistent dates, and define metrics the same way each time. This consistency is the foundation of advanced thumbnail optimization and long-term growth. That's what keeps every dashboard comparison aligned.
Tool Comparison at a Glance
Use this table to match each tool to the job it does best: design, testing, tracking, or reporting. It’s a simple way to pick the right fit for your workflow before you move into the tracking process.
| Tool | Best Use Case | Data Type | A/B Testing | Dashboards/Exports |
|---|---|---|---|---|
| ThumbnailCreator | AI thumbnail design and variant creation | Indirect | No | Yes |
| YouTube Studio Analytics | Native CTR and impression tracking (see our thumbnail glossary for metric definitions) | Native | No | Yes |
| YouTube Test & Compare | Official A/B testing for CTR and watch time | Native | Yes | No |
| TubeBuddy | Bulk metadata and legacy A/B testing | API-based | Yes | Yes |
| vidIQ | Competitor research and trend alerts | API-based | No | Yes |
| Google Sheets | Custom logging and manual trend analysis | Indirect | No | Yes |
| Looker Studio | Automated visual performance dashboards | API-based | No | Yes |
YouTube Studio and YouTube Test & Compare are the only native tools in this list. That matters because they give you the fastest read on thumbnail changes without relying on outside data pulls.
After you choose a tool, the workflow below shows how to track thumbnail trends across 7, 28, and 90 days.
A Simple Thumbnail Tracking Workflow for U.S. Creators
Use the same workflow for every upload. Stick to the same checkpoints each time so every video is judged on the same schedule.
Build Controlled Thumbnail Variants Before Publishing
Create one controlled variant for each upload. Change just one element, then run Test & Compare or note the manual swap date. If testing isn’t available, leave the title alone so the before-and-after data stays comparable. That gives you a clean baseline for the 7-day check.
Check Early Signals at 7 Days
At 7 days, look at Reach first. Check CTR, impressions, and traffic-source mix before you decide whether the thumbnail is doing its job. Save those numbers, then compare them again at 28 days.
Look for Stronger Patterns at 28 Days
At 28 days, compare CTR with AVD and first-30-second retention. This is where surface-level clicks start to separate from viewer behavior. Then use the 90-day view to see if the same pattern still shows up.
Confirm Long-Term Direction at 90 Days
At 90 days, check whether CTR stays steady after early promotion starts to fade. That helps you see if the thumbnail still works once the first push is over.
Log Results in Sheets or Dashboards
Track each checkpoint in Google Sheets or a Looker Studio dashboard using MM/DD/YYYY date formatting. For each video, log:
- Review date
- Impressions
- CTR
- AVD
- Primary traffic source
Over time, that log makes it much easier to spot which visual styles keep winning across videos. Reviewing data-driven thumbnail insights can help you identify these patterns faster.
Conclusion
Don’t rely on a single tool to track thumbnail trends. Use a stack instead.
Here’s the simple way to think about it: each tool does a different job. Use YouTube Studio as your final check before you decide what stays and what goes. It should be your source of truth for CTR, impressions, watch time, retention, and traffic-source shifts. Then use creation tools to make variants, tracking tools to spot trends, and dashboards to log what happened over time.
Once you’ve tested and tracked enough thumbnails, stick to one review cycle you can run again and again. Create controlled variants, check 7-day signals, confirm the direction at 28 days, and verify the pattern at 90 days. That’s how you find thumbnail patterns that still work when reach grows.
FAQs
Which thumbnail metrics matter most?
Focus on click-through rate (CTR) and watch time. CTR tells you how well your thumbnail earns the click. Watch time tells you whether the video pays off that promise.
Watch time matters because a high CTR paired with low retention can look like clickbait, which may limit future reach. It also helps to check these metrics by traffic source, since benchmarks vary across search, browse, and notifications.
How long should I wait after a thumbnail change?
After you change a thumbnail, give the early spike time to settle. Don’t judge the result in the first 24–48 hours. Those first hours can be noisy, and they can skew what’s actually going on.
For a new upload, wait about 2–3 days before you start the test or try to read the data.
Then let the thumbnail test run for 7–14 days. Before you make a call, aim for at least 1,000 impressions per variant.
What if CTR goes up but retention drops?
If CTR goes up but retention drops, your thumbnail may be pulling in the wrong viewers or promising more than the video gives.
That mismatch matters. YouTube’s “Test & Compare” puts more weight on watch time share than raw CTR alone. So a thumbnail that gets more clicks but leads to weaker viewing time can still lose.
The fix is pretty simple: make sure the thumbnail and title match what the video actually delivers. Then test new versions instead of sticking with the high-CTR, low-retention option.