

Ultimate Guide to Thumbnail Analytics for YouTube
Most thumbnail decisions should come down to two numbers: CTR and watch time. If people click but leave fast, the thumbnail is doing damage—often due to common thumbnail mistakes that hurt retention. If fewer people click but those viewers stay, the video may be fine and the packaging may be the weak spot.
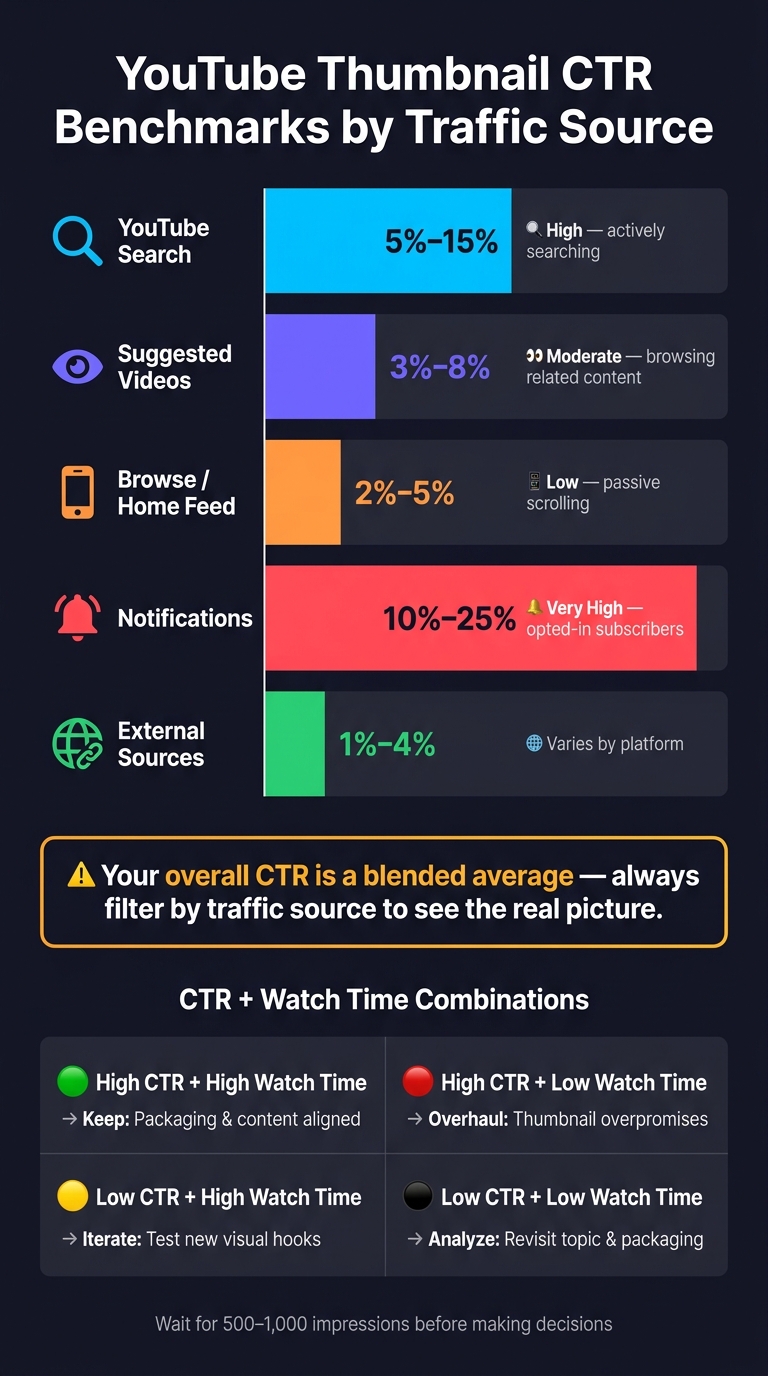
Here’s the short version: I’d judge a thumbnail by impressions, CTR, traffic-source CTR, average view duration, watch time, and retention. I’d also check performance at 24 hours, 7 days, and 28 days, wait for at least 500 to 1,000 impressions before making a call, and review each traffic source on its own. A thumbnail that gets 5%–15% CTR from Search may still struggle on Home, where 2%–5% CTR is more common. And notification traffic can run much higher, often 10%–25%.
If I wanted a simple workflow, I’d use this:
- Check Reach first: impressions, CTR, and traffic-source CTR
- Pair clicks with viewing data: average view duration, watch time, and retention
- Compare sources: Search, Browse, Suggested, Notifications, and External
- Test one change at a time: text, face, color, or layout
- Track results over time: style, word count, color, source, CTR, and watch time %
- Turn repeat winners into templates: especially after 10 to 20 tests
Here’s the main takeaway: a thumbnail should not be judged by how it looks. It should be judged by whether it gets the right click and leads to a solid viewing session. The rest of the guide explains how I’d read those numbers, test changes, and build rules from what keeps working.
Test YouTube Titles & Thumbnails to Increase CTR – Full Tutorial
sbb-itb-b59debf
1. The thumbnail metrics that matter in YouTube Studio
YouTube Thumbnail CTR Benchmarks by Traffic Source
In YouTube Studio, start with three signals: impressions, CTR, and watch time. Impressions show how often people saw your thumbnail. CTR shows how often those views turned into clicks. Watch time shows whether those clicks led to people sticking around.
Then take one more step: break those numbers out by traffic source. That’s where you see whether a thumbnail is doing its job or falling flat.
Impressions, CTR, and the first 24 hours
An impression is counted each time YouTube shows your thumbnail to a viewer. CTR is simply clicks divided by impressions.
A lot of channels sit around 2% to 5% CTR, but your own baseline matters more than any broad benchmark.
The tricky part is early data. In the first 24 hours, YouTube often pushes a new video to subscribers and people who turned on notifications. That group is warmer than a broad audience, so CTR can look better than it will later. Notifications usually drive the highest CTR, often around 10% to 25%.
For established channels, a steadier picture often shows up within 24–48 hours. Smaller channels may need 1–2 weeks. Even then, don’t rush the call. Wait until the video has at least 500 to 1,000 impressions before you treat the data as useful.
Traffic source CTR and performance by traffic source
Your overall CTR is just one blended number. The problem is that YouTube surfaces don’t behave the same way, so that average can hide what’s going on.
Here are the typical CTR ranges by source:
| Impression Source | Typical CTR Range | Viewer Intent |
|---|---|---|
| YouTube Search | 5%–15% | High - viewer is actively looking for this topic |
| Suggested Videos | 3%–8% | Moderate - interested in related content |
| Browse (Home) | 2%–5% | Low - passive scrolling, no specific intent |
| Notifications | 10%–25% | Very high - existing subscribers opted in |
| External Sources | 1%–4% | Varies by platform and context |
This matters because not every click is earned the same way. Search traffic usually comes from people already looking for that topic. Browse is different. On Home, your thumbnail has to stop someone mid-scroll.
That’s why a strong Search CTR can look good on paper but still miss the bigger issue. It doesn’t tell you if the thumbnail can grab a casual viewer.
To check that, go to the Reach tab in YouTube Studio and filter by Traffic Source. If Browse CTR is weak but Search CTR is strong, the thumbnail likely needs more contrast or a stronger pattern interrupt. Then compare those CTR numbers with watch time. That will show you whether the thumbnail is pulling in the right viewer or just getting the click.
CTR versus watch time: when a thumbnail helps or hurts
A high CTR is not always good news. If people click and leave fast, YouTube may take that as a sign that the thumbnail promised more than the video delivered. Over time, that mismatch can cut distribution.
The reverse is also true. A lower CTR is not always bad. If the people who do click stay and watch, the video may be reaching the right audience even if the packaging needs work.
| Metric Combination | Interpretation | Recommended Action |
|---|---|---|
| High CTR, low watch time | The thumbnail overpromises | Overhaul: Match the thumbnail to the video |
| Low CTR, high watch time | Packaging failure; content is strong but the thumbnail isn't earning the click | Iterate: Test new visual hooks |
| High CTR, high watch time | Packaging and content are aligned | Keep: Reuse this structure |
| Low CTR, low watch time | General underperformance; neither topic nor packaging is resonating | Analyze: Recheck the topic and packaging |
This is the part many creators miss. CTR tells you if people clicked. Watch time tells you if they were glad they did.
Use those two together when deciding whether to keep the thumbnail, tweak it, or swap it out.
2. How to use YouTube Studio to analyze thumbnail performance
Use YouTube Studio to see where a thumbnail is doing its job and why. Once you've checked CTR and watch time, Studio helps you spot which part of the thumbnail funnel changed.
| Studio View | Question It Answers | What to Watch |
|---|---|---|
| Reach Tab | Is the thumbnail earning the click? | Impressions, CTR, traffic sources |
| Audience Tab | Which thumbnail styles already work for my viewers? | "Videos your audience watches" patterns |
| Engagement Tab | Are clicks leading to sustained watch time? | Average View Duration (AVD), watch time |
| Advanced Mode | Did the swap improve CTR and watch time? | CTR and watch time across date ranges |
Start with Reach. Then use Audience and Advanced Mode to figure out why the numbers moved.
Reach tab: where thumbnail performance shows up first
After you publish, go to the Reach tab for that video. This is where you'll see the "Impressions and how they led to watch time" funnel. It shows how many people saw your thumbnail and how many clicked.
YouTube only counts an impression if at least 50% of the thumbnail is visible on screen for more than 1 second. So this data reflects actual exposure, not simple page loads.
Use the traffic source filter to see which surfaces respond best. If Search CTR looks strong but Browse CTR looks weak, that usually means the thumbnail works for people with clear intent, but not for casual scrollers.
When one surface falls short, use Audience and Advanced Mode to shape the next version.
Audience insights that shape better thumbnail ideas
The "Videos your audience watches" section in the Audience tab shows what other videos your viewers click across YouTube. Pay attention to patterns in those thumbnails, like faces, short text, color choices, and layout.
That matters because your audience's habits are a better signal than generic thumbnail tips. Use those patterns as raw material for your next test. A face, for example, doesn't help just because people say it should. It helps when your viewers already click that kind of image. Analysis of 25,000+ thumbnails found that adding faces to thumbnails can lead to a +38% CTR advantage, but only when it fits your audience.
Advanced Mode and before-vs.-after analysis
If you swap a thumbnail by hand, without YouTube's built-in A/B testing tool, or a dedicated thumbnail A/B testing guide, Advanced Mode is the best place to check the result. Open Advanced Mode in YouTube Studio, pick the video, and compare equal date ranges before and after the swap.
After the change, review CTR and watch time together. Keep both comparison windows the same length, and watch out for weekends or holidays since either can skew the numbers.
A higher CTR sounds great. But if watch time drops, the thumbnail may be pulling in the wrong clicks.
3. Testing thumbnails with repeatable, data-driven methods
Once your analytics show what changed, the next step is figuring out why. That’s where controlled testing comes in.
A one-time thumbnail swap can give you a data point. A repeatable test can give you a pattern you can use again. The key is simple: keep the setup steady, change one variable, and wait until the video has enough impressions before you make a call.
| Method | Setup Effort | Control over Variables | Common Use Cases | Data Needs |
|---|---|---|---|---|
| YouTube Test & Compare | Low (Native tool) | High (Concurrent testing) | New uploads and existing videos | High (Needs enough impressions for significance) |
| Manual A/B Testing | Medium (Manual swaps) | Low (Sequential, time-biased) | Older videos; channels without Advanced Features access | Moderate (Requires careful date/metric logging) |
| AI-assisted variant creation | Low (Rapid generation) | High (Easy to isolate elements) | Fast concept generation | Testing still needs enough impressions |
Use the method that fits your access level and traffic volume.
Using YouTube Test & Compare for thumbnail experiments
YouTube Test & Compare runs concurrent tests inside desktop Studio when Advanced Features are enabled. It does not work for Shorts, Made for Kids content, or private videos.
One detail matters a lot here: YouTube picks winners based on watch time, not CTR. So if YouTube declares a winner, don’t swap it out just because another version had a higher CTR. A thumbnail that gets more clicks but loses viewers right away can hurt long-term reach.
Manual testing rules that prevent bad conclusions
If the native tool isn’t available, manual swapping can still work. You just need to be strict about the setup.
Change only one element per test. That could be the facial expression, the text, or the background color, but not all three at once. If you change several things at the same time, the result gets muddy fast, and you won’t know what actually moved the metric.
Manual tests usually need 7 to 14 days, and you should ignore the first 24 to 48 hours. Early data can bounce around too much. Also, give more weight to a clear gap than to tiny swings that could just be noise. Older videos with steady traffic tend to work best for this kind of test.
Creating faster test variants with ThumbnailCreator
For most teams, the slow part isn’t reading the data. It’s making enough thumbnail versions to test in the first place.
Building clean variations with different expressions, text, or backgrounds can eat up a lot of time if you’re doing everything by hand in a design tool.
ThumbnailCreator speeds up that step. Its AI generation, face swapping, object swapping, and text editing features help you turn one base concept into several test-ready versions while keeping CTR and watch time as your two decision metrics.
A simple workflow looks like this:
- Generate several concepts
- Cut that list down to three
- Test them in YouTube
- Build the next round from the winner
Then save the winning version as the baseline for your next upload.
4. Tracking trends and building a long-term thumbnail system
Treat each thumbnail test like a data point, not a one-off event. The goal is to let patterns stack up across uploads so you can compare what works across your channel, not just on a single video, or relying on A/B testing vs gut feeling.
Spotting trends across time, topics, and thumbnail styles
Once you've tested individual thumbnails, sort the results by style, topic, and traffic source. That’s where things start to click.
You might notice that one thumbnail family gets more clicks on the Home feed, while another works better for Search or Suggested. In most cases, that pattern doesn’t show up right away. It usually takes 10 to 20 tests before the signal is clear. After that, you’re not guessing anymore. You’re designing based on repeat use data.
Put those patterns in one place so you can review them later without digging through old uploads.
Building a simple dashboard or spreadsheet
A basic spreadsheet is enough. What matters is using the same columns every time and logging both the result and the design choice behind it.
Track:
- thumbnail style
- text word count
- dominant color
- primary traffic source
- CTR
- impressions
- watch time %
Also add an Action Taken column. That’s the bridge between data and your next move. If a result leads to no change, the sheet isn’t doing much for you.
Use the same naming style every time for thumbnail types, such as "Close-up Face", "Split Screen," or "Minimalist Text." That makes filtering much easier, and you can compare design families fast.
| Video Title | Publish Date | Thumbnail Style | Traffic Source Focus | CTR | Impressions | Watch Time % | Action Taken / Insight |
|---|---|---|---|---|---|---|---|
| 10 Tips for SEO | June 1, 2026 | Close-up Face + 3 words | Home feed | 6.2% | 50,000 | 55% | Winner; keep "Benefit" text style. |
| My Morning Routine | June 5, 2026 | Wide shot, no text | Suggested | 3.1% | 12,000 | 40% | Underperformed; add text overlay. |
| Product Review X | June 12, 2026 | Split screen (Before/After) | Home feed | 7.5% | 85,000 | 62% | High performer; use split-screen for reviews. |
| How to Scale | June 20, 2026 | Minimalist, Blue/White | Search | 4.4% | 20,000 | 48% | Neutral; test warmer colors next time. |
Older videos can also help here because they often give steadier trend lines for cleaner month-over-month comparisons.
Turning results into templates and channel rules
When the same pattern keeps showing up, turn it into a rule.
For example, if a 3- to 5-word text overlay keeps winning, make that your default. Thumbnails with six or more words see average CTR drop to 4.3%. If natural micro-expressions keep beating exaggerated faces, build that look into your channel templates.
Save your top layouts as reusable templates so you’re not rebuilding from scratch each time. You can use ThumbnailCreator to save winning layouts as reusable templates.
That way, each new upload starts from what has already worked.
Conclusion: A practical workflow for better YouTube thumbnails
After testing, the next step is simple: turn what you learned into a repeatable publishing habit. Thumbnail analytics work best as a loop - analyze, test, document, repeat. Each upload should shape the next thumbnail choice.
Use CTR and watch time together to decide whether to keep, swap, or test the thumbnail again. If CTR is high but early retention falls off, the thumbnail and title may be promising more than the video delivers.
Thumbnails should be judged by performance, not by how they look. A few rules help keep that clear:
- High CTR only matters when retention holds. Lots of clicks with weak retention points to a packaging issue, not a content win.
- Judge each surface separately; Home and Search often need different thumbnail fixes. People come in with different intent depending on where they see the video.
- Tests need enough data to mean anything. Aim for at least 1,000 impressions per variant before drawing conclusions.
- Trend tracking reveals channel-wide winners. One strong result is a clue. The same result across several videos is a pattern worth using again.
Open YouTube Studio and review your last 10 videos. Log CTR, impressions, traffic-source CTR, average view duration, and early retention. Label each thumbnail by face or no face, word count, and dominant color. Then look at what your above-average performers share.
From there, pick one variable to test on your next upload. Use ThumbnailCreator to make test variants faster. Then run the same process again on the next video.
The goal is a process that makes each thumbnail more informed than the one before it.
FAQs
What is a good thumbnail CTR on YouTube?
A good YouTube thumbnail CTR is usually 4%–5%. But that number can shift based on your niche, audience size, and where the views come from.
A simple rule of thumb looks like this:
- Below 2%: poor
- 2%–5%: average
- 5%–10%: strong
- Above 10%: elite
The big thing is context. A CTR that looks great in one traffic source can look normal in another.
It’s smart to compare CTR by traffic source instead of looking at one blended number. For example, Search often lands around 8%–15% because people are already looking for that topic. Browse features tend to be lower, usually around 3.5%–4.5%, since viewers are scrolling and making split-second choices.
Also, check retention. A high CTR sounds great, but if people click and leave fast, your thumbnail may be selling something the video doesn’t deliver.
Why is high CTR sometimes bad?
A high CTR can actually hurt if it comes with low average view duration (AVD).
Here’s why: the thumbnail or title may have won the click, but the video itself didn’t deliver on what people expected.
When viewers click and leave fast, YouTube can read that as a sign the video wasn’t satisfying. Over time, that can lead to fewer recommendations.
So high CTR alone isn’t enough. If retention is weak, performance can slip even when clicks look strong.
When should I change a thumbnail?
Consider changing a thumbnail when a video has low CTR but solid average view duration. That’s usually a clear sign the video itself is doing its job, but the thumbnail isn’t getting enough people to click.
You can also swap thumbnails on older videos that aren’t doing well to spark new interest. If you want to test a new thumbnail, give the video 2 to 3 days after publishing before you start. Then use YouTube’s Test & Compare feature and let the test run for 7 to 14 days.