
Ultimate Guide to Thumbnail CTR Analysis
Want more clicks on your YouTube videos? Your thumbnail might be the key. Click-Through Rate (CTR) measures how often people click on your video after seeing its thumbnail. A higher CTR means more views and better performance on YouTube. Here’s what you need to know:
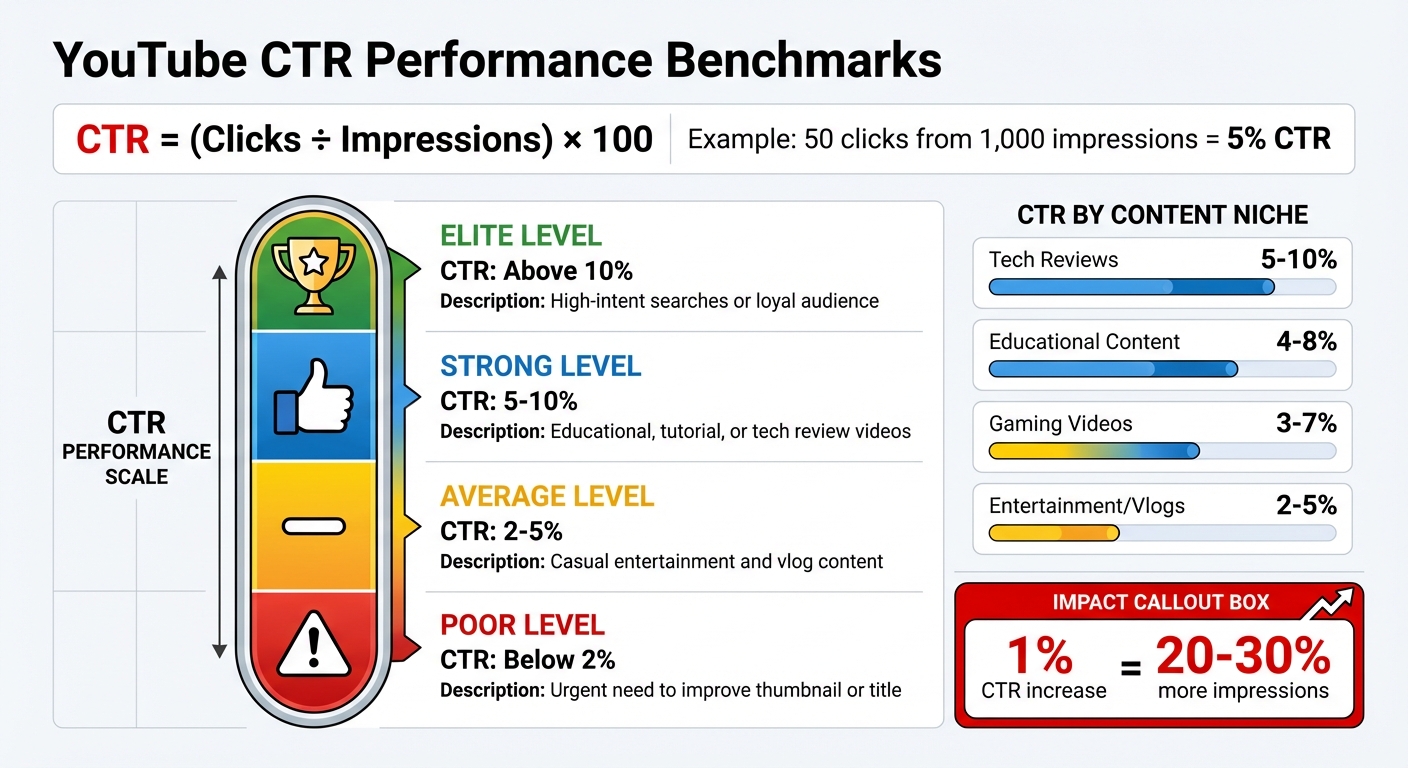
- CTR Formula: (Clicks ÷ Impressions) × 100. Example: 50 clicks from 1,000 impressions = 5% CTR.
- Why It Matters: A strong CTR signals to YouTube that your content grabs attention, increasing recommendations.
- Benchmarks:
- Poor: Below 2%
- Average: 2–5%
- Strong: 5–10%
- Elite: Above 10%
- Traffic Sources:
- Search: High CTR, fewer impressions.
- Homepage: High impressions, lower CTR.
- Suggested: CTR varies based on relevance.
To improve CTR:
- Use high-contrast colors and bold text (under 12 characters).
- Include expressive faces and stick to the 3-element rule (face, object, text).
- Test thumbnails with tools like ThumbnailCreator and run A/B tests to find what works.
CTR isn’t everything - pair it with retention metrics to avoid clickbait. Analyze your data, tweak designs, and keep testing to grow your channel. Even a small CTR boost can lead to big results.
The Thumbnail Experiment: Using Science to Boost CTR
What Is YouTube CTR and Why It Matters
YouTube CTR Benchmarks and Performance Levels Guide
Click-Through Rate (CTR) measures how many people click on your video after seeing its thumbnail and title. The formula is simple: CTR = (clicks ÷ impressions) × 100. For example, if your video gets 50 clicks out of 1,000 impressions, your CTR would be 5%.
An "impression" happens when your thumbnail is visible for at least one second, with at least 50% of it on the screen [15, 19].
CTR plays a big role in how YouTube evaluates your content. A high CTR tells the platform that your video is grabbing attention, which can lead to more recommendations and better search rankings [16, 17]. As Mohammad Qaiser, Founder and CEO of Your Video Editor, puts it:
"CTR signals relevance to YouTube's algorithm, driving more impressions... However, watch time and session time matter more after the click."
But CTR alone doesn't tell the whole story. Pair it with Average View Duration (AVD) to get a clearer picture. A high CTR with low retention often signals clickbait - catchy thumbnails or titles that fail to deliver on their promise. This can hurt your video's future recommendations. On the flip side, a low CTR but high retention suggests your content is engaging, but your thumbnail or title might need some tweaking [6, 16, 20].
CTR also depends on where your traffic is coming from. Search results usually produce higher CTRs because viewers are actively looking for specific content. Meanwhile, homepage impressions often yield lower CTRs since users are browsing more casually [6, 16]. As your video's audience grows beyond your core followers, CTR may naturally decline even as total views rise.
YouTube CTR Benchmarks Explained
Most YouTube channels and videos see CTRs ranging from 2% to 10% [15, 16, 18]. Knowing where your videos stand within this range can help you measure success and identify areas for improvement.
| Performance Level | CTR Benchmark | What It Means |
|---|---|---|
| Poor | Below 2% | Signals an urgent need to improve your thumbnail or title |
| Average | 2–5% | Common for casual entertainment and vlog content |
| Strong | 5–10% | Often found in educational, tutorial, or tech review videos |
| Elite | Above 10% | Typically achieved through high-intent searches or a loyal audience |
Different niches come with different CTR expectations. For example:
- Tech reviews often land between 5–10%.
- Educational content usually sees 4–8%.
- Gaming videos range from 3–7%.
- Entertainment and vlogs typically hover around 2–5%.
Even small adjustments can make a noticeable difference. A 1% increase in CTR might translate to 20–30% more impressions, especially in competitive niches. It's also helpful to evaluate CTR by traffic source. For instance, a 3% CTR from homepage impressions might be strong, but the same rate in search results could indicate your title and thumbnail need work [6, 16].
How CTR Affects Your Video Rankings
YouTube's algorithm ranks your video based on how it performs compared to other videos a viewer might choose. If your CTR is lower than competing videos, your content might rank lower in search results and feeds [17, 20]. This makes a compelling thumbnail and title essential.
A good CTR signals to YouTube that your video is drawing attention, which can lead to broader recommendations. However, as YouTube Help explains:
"Clickbait videos tend to have low average view duration and therefore are less likely to get recommended by YouTube."
The relationship between CTR and rankings isn't straightforward. A video with a 3% CTR but strong retention might still gain traction, while a video with a 10% CTR but poor retention could lose favor quickly. YouTube prioritizes viewer satisfaction, considering both the initial click and what happens after.
With 63% of views coming from mobile devices, make sure your thumbnail text is clear and readable at a resolution of 360×640.
Even if you achieve high CTR and AVD, your impressions might plateau if your topic is too niche or if you're competing in a saturated field with established creators. In these cases, improving CTR alone may not be enough - you might need to adjust your content strategy or target new keywords.
Next, we'll explore how to find and analyze CTR data in YouTube Analytics.
How to Find and Read CTR Data in YouTube Analytics
Accessing CTR data is simple:
- On Desktop: Log in to YouTube Studio → go to Analytics → click the Content tab. To view data for a specific video: head to Content, hover over the video, select Analytics, and navigate to the Reach tab.
- On Mobile: Open the YouTube Studio app → go to Content → choose a video → select Analytics → tap on the Reach section.
This data connects raw numbers to viewer behavior, offering insights for deeper analysis.
Check out the "Impressions and how they led to watch time" report. This visual breakdown highlights how your thumbnails drive views and watch time. It also shows the percentage of impressions coming from YouTube's recommendations.
For accurate CTR data, wait until your video has accumulated a substantial number of impressions. Videos with fewer than 100 views or those less than a week old often display fluctuating CTRs that fall outside the usual 2–10% range. Afterward, focus on key metrics to assess your thumbnail's performance effectively.
Which Metrics to Track
To measure how well your thumbnails are performing, keep an eye on three key metrics: impressions, CTR, and traffic sources.
- Impressions: This shows how often YouTube displays your thumbnail, reflecting how widely the algorithm is distributing your content.
- CTR (Click-Through Rate): CTR reveals how often viewers click on your video after seeing the thumbnail. It’s a direct measure of how appealing your video packaging is.
- Traffic Sources: This metric identifies where your impressions are coming from, such as YouTube Search, the Homepage, or Suggested Videos.
Each traffic source influences CTR differently based on viewer intent and behavior:
| Traffic Source | Viewer Intent | Viewer Behavior |
|---|---|---|
| YouTube Search | High (looking for answers) | Fewer impressions but higher CTR due to relevance |
| Homepage (Browse) | Low (exploring content) | High impressions but lower CTR due to competition |
| Suggested Videos | Medium (related interest) | Impressions depend on the viewer’s current activity |
| Subscriptions Feed | Very high (loyal audience) | Highest CTR from dedicated viewers, though impressions are more limited |
It’s also crucial to pair CTR data with Average View Duration. A high CTR combined with low retention might signal clickbait, which could lead YouTube to reduce recommendations for your video. On the other hand, a dropping CTR as impressions grow often means your video is reaching a broader audience beyond your core viewers.
Keep in mind, not all impressions are treated equally. YouTube counts impressions from Search, the Homepage, "Up Next" suggestions, and playlists. However, impressions from external sites, email notifications, end screens, and the mobile version of YouTube's website (m.youtube.com) are excluded.
How to Design Thumbnails That Get More Clicks
Once you’ve analyzed your CTR data, the next step is turning that insight into thumbnail designs that encourage clicks. The difference between a 3% CTR and an 8% CTR often boils down to a few key design strategies that successful creators have honed through testing and iteration.
Design Elements That Increase CTR
High contrast is your secret weapon. Your thumbnail needs to jump off the page, especially against YouTube's white and gray interface. Use complementary colors like red and blue or yellow and purple to create contrast and make your design pop. Research suggests high-contrast thumbnails can boost CTR by up to 45%. To amplify this effect, ensure your main subject is at least 30% brighter or darker than the background.
Limit your text. Since about 70% of YouTube viewing happens on mobile devices, thumbnails often appear very small. To keep things readable, stick to a maximum of 12 characters and use bold, sans-serif fonts like Montserrat or Impact.
Human faces work wonders - especially expressive ones. Thumbnails featuring faces tend to attract more attention, with videos including faces averaging 921,000 more views than those without. Highlight strong emotions by slightly exaggerating features like wide eyes or an open mouth to convey surprise or shock. Even sad expressions have been shown to drive engagement.
Stick to the "3-Element Rule." Simplicity wins. Include just one face, one focal object, and one short piece of text. With viewers deciding in just two seconds whether to click, a cluttered thumbnail can hurt more than help. Ryan Trahan’s "$0.01 Survival" video is a great example, featuring only his face, a penny, and the text "7 DAYS".
"Thumbnails are not art. They're mind games. Every face, color, word hacks human attention." – ThumbnailPilot
Use visual cues to spark curiosity. Add elements like arrows, circles, or before-and-after contrasts to hint at a story. For instance, transformation thumbnails in niches like DIY or fitness can increase CTR by up to 35%.
| Element | Impact on CTR |
|---|---|
| Including a Face | +35–50% higher CTR |
| High Emotional Intensity | 2× more likely to click |
| Bold Color Contrast | Up to +45% CTR boost |
| Under 12 Characters of Text | Outperforms text-heavy designs |
| Red/Yellow Highlights | Up to +20% increase |
Separate your subject from the background. Use techniques like a 4–8 pixel stroke, outer glow, or Gaussian blur to make your focal point stand out. Avoid placing text or key elements in the bottom-right corner, where YouTube’s timestamp might obscure them.
MrBeast’s thumbnails are a masterclass in these principles. His team transitioned from text-heavy images to high-contrast designs with bold facial expressions and minimal text. This approach has helped his channel achieve CTRs of 8–12%.
If you’re ready to take your thumbnails to the next level, advanced tools can help streamline the process.
Using ThumbnailCreator to Create Better Thumbnails
Applying these principles doesn’t have to be time-consuming. AI-powered tools like ThumbnailCreator simplify the process, making it easier to produce professional-quality thumbnails in minutes.
AI-generated concepts save time. Instead of starting from scratch, enter your video title, and the AI will generate multiple thumbnail options. This is especially useful for gaming content, where stylized character compositions often outperform raw gameplay screenshots. The tool also automates tasks like background removal, subject isolation, and color adjustments.
Face swapping enhances emotional appeal. If your original footage lacks the right expression, swap in a more emotive face. Thumbnails with exaggerated emotions can increase CTR by 20–30% compared to neutral expressions.
Object swapping sparks curiosity. Experiment with different focal points - like replacing a dollar bill with a trophy - to see what resonates most with your audience. Testing these variations can help you achieve CTRs of 5–10%.
Templates ensure mobile-friendly designs. ThumbnailCreator’s templates are built with "safe areas" to keep text and faces clear of YouTube’s timestamp. They also enforce contrast and simplicity rules so your designs remain effective on smaller screens.
Consistent branding builds loyalty. Just like WIRED uses color-coded templates for easy recognition, ThumbnailCreator lets you establish a consistent style for your channel. This kind of visual branding can boost click rates by up to 38% as viewers quickly recognize your content.
With these tools and strategies, you can create thumbnails that not only stand out but also drive meaningful engagement.
sbb-itb-b59debf
Advanced CTR Analysis Methods
Understanding where your clicks come from and who’s clicking can turn your thumbnail strategy into a well-oiled, data-driven system.
CTR (Click-Through Rate) varies widely depending on the traffic source, as viewer intent shifts across different surfaces. For example, YouTube Search often produces higher CTRs but fewer impressions because viewers are actively searching for specific answers. The Homepage (Browse), on the other hand, generates many impressions but lower CTRs since users are casually scrolling in "discovery mode". Suggested Videos fall somewhere in the middle, with CTRs that depend on how closely your content matches what viewers just watched.
| Traffic Source | Impression Volume | Typical CTR | Viewer Intent |
|---|---|---|---|
| YouTube Search | Lower | Higher | High (Specific need/query) |
| Homepage (Browse) | High | Lower | Low (Discovery/Browsing) |
| Suggested Videos | High | Variable | Moderate (Related interest) |
| Subscribers/Feeds | Moderate | Higher | High (Brand loyalty) |
Breaking down CTR by traffic source helps identify the difference between loyal subscribers and new viewers from Browse or Suggested Videos. A thumbnail that resonates with subscribers might fail to attract casual viewers, who are crucial for growing your channel. For instance, if your CTR is strong in Search but weak on the Homepage, it means your thumbnail works for intent-driven queries but struggles to grab the attention of casual scrollers. Adjust your designs based on these performance differences.
To review this data, head to YouTube Studio, navigate to Analytics > Reach, and click "See More" under top videos. Use the "+" button to add "Impressions click-through rate" to your table, then filter by traffic source. Export the data as a CSV or to Google Sheets for long-term trend analysis across your uploads.
Pair CTR analysis with Average View Duration (AVD) to ensure that high click rates also translate to engaged viewership. YouTube’s algorithm can pick up on CTR differences as small as 0.5% when measured across millions of impressions, so even small improvements can make a difference.
Once you’ve gathered insights, start testing variations using A/B experiments.
How to Run A/B Tests on Your Thumbnails
YouTube’s built-in "Test & Compare" tool (available in YouTube Studio) allows you to split traffic between thumbnail variations and determine which one generates more watch time share - not just clicks. This ensures your thumbnail isn’t just attracting clicks but also keeping viewers engaged.
Set up your tests with care. Change only one element at a time - such as facial expression, background color, or text placement - and let the test run until each variant receives at least 1,000 impressions over a minimum of 7 days. Cutting the test short based on small fluctuations can lead to inaccurate conclusions.
In August 2025, vidIQ tested three thumbnail designs for a video on AI developments. One featured a simple image of an AI robot. That design ended up capturing 59.7% of total watch time. After adopting the winning design permanently, the video achieved nearly triple its usual view count.
"Great thumbnails don't just get viewers to click. They also help viewers understand what the video is about, so that they can make informed decisions about what to watch." – YouTube Studio
Segment your results by traffic source. A thumbnail that performs well in Search might not succeed on the Homepage. If most of your traffic comes from Browse, focus on the variant that excels there. Creators who consistently A/B test thumbnails report an average CTR boost of 154% within three months, with the top 10% seeing over 300% improvement.
Prioritize high-visibility videos for testing. Skip A/B testing for low-traffic or time-sensitive videos where optimization takes a backseat to speed. Focus instead on high-visibility or evergreen content that will continue to attract views over time.
Once you’ve identified winning designs, analyze long-term patterns to refine your strategy.
Finding Patterns in Your CTR Data
After A/B testing, export your CTR data to uncover trends across your top-performing videos. The goal is to identify patterns in thumbnail designs that consistently resonate with your audience.
Start by exporting CTR data for your top 50 videos. Look for recurring design elements in high-performing thumbnails. Do they feature a face? Use bold colors? Keep text minimal? These insights can guide future designs, helping you replicate success intentionally.
A CTR drop from 9% to 3.5% can still be a win if impressions skyrocket (e.g., from 10,000 to 100,000). This shift often occurs when your video reaches a broader audience beyond your core subscribers. As YouTube explains, "3% of a million impressions represents more actual viewers than 10% of a thousand impressions".
Compare performance between subscribers and non-subscribers. Thumbnails that appeal to loyal fans might not work as well for Suggested or Browse traffic, where new viewers dominate. Growth often comes from attracting these new audiences, so prioritize designs that resonate with them.
"A thumbnail that pulls new audiences in is often more valuable than one that just appeals to loyal fans." – YouTube Creator Academy
Track long-term trends, not just short-term results. If you tweak a thumbnail to improve performance, give it at least 30 days before evaluating the impact to avoid short-term fluctuations. Use YouTube Studio’s export feature to analyze historical data and spot patterns across your entire library.
Don’t overlook older content. Use the "Reach" tab in YouTube Studio to find older videos with low CTR but high impression potential. Updating thumbnails for these videos can unlock significant traffic without creating new content. Since over 70% of YouTube watch time happens on mobile devices, ensure your redesigns are mobile-friendly with bold visuals and minimal text.
Using CTR Data to Improve Future Thumbnails
Turn your CTR insights into a system for creating thumbnails that consistently drive results. Instead of relying on trial and error, this method builds a structured, data-driven approach to thumbnail design - helping your channel grow steadily over time. Here's how to put this into action.
Repeating What Works in Your Thumbnails
Once you've completed A/B testing, create a swipe file of your best-performing thumbnails, organized by traffic source. This will help you spot recurring design elements that resonate with your audience. For example, do high-CTR thumbnails often feature close-up facial expressions? Are bold color combinations or concise text (under 12 characters) a common thread? These patterns can guide your future designs.
Here’s a practical example: If your data reveals that thumbnails with surprised facial expressions achieve a 2% higher CTR compared to neutral ones, it’s worth making this style your go-to. Similarly, if bright, contrasting colors like yellow and purple outperform muted tones, consider adding those to your standard color palette.
Tools like ThumbnailCreator's AI can help you scale these insights. By analyzing your last 10–20 uploads, you can pinpoint successful elements and replicate them. Features like face swapping or object swapping in the Pro Plan make it easy to tweak elements - such as changing a neutral expression to a surprised one - without starting from scratch.
Monitoring CTR Improvements Over Time
Keep an eye on your average CTR to measure the impact of your design tweaks. Export your YouTube Studio data every 30 days and compare it to previous months. Document your A/B test results to simplify future adjustments and refine your strategy.
Creators who regularly test and optimize their thumbnails often see dramatic results. On average, CTR improves by 154% within three months, and the top 10% of creators achieve over 300% gains. Even small wins add up - a 1% CTR boost can potentially double your video views. Be sure to note which thumbnail variant performed best, the percentage difference, and which traffic source responded most strongly.
Give your changes time to work - wait at least 14 days after updating a thumbnail before drawing conclusions. For evergreen content, refresh thumbnails every 4–6 months to combat "visual fatigue." Older videos with high impression counts but declining CTR are ideal candidates for redesigns, as a fresh thumbnail can revive their performance without creating new content.
Conclusion
Your thumbnail's click-through rate (CTR) is a critical factor in signaling to YouTube whether your content deserves more visibility. Since thumbnails influence 90% of click decisions, even small tweaks can lead to noticeable increases in views.
Start by diving into your YouTube Analytics to monitor CTR alongside metrics like Average View Duration. Look for trends in your best-performing thumbnails to identify effective design elements.
Focus on mobile-friendly designs. With more than 70% of YouTube views happening on mobile devices, your thumbnails need to be easily readable on smaller screens. Use high-contrast colors, limit text to 3–4 bold words, and ensure your main subject stands out. Tools like ThumbnailCreator can simplify this process with AI-driven features like templates, face swapping, and object editing, all optimized for the right resolution.
Once your design is ready, test its performance. A/B testing is a must for improving your thumbnails. Test one change at a time, run each test for at least 14 days or until you hit 1,000 impressions, and adjust underperforming thumbnails based on the results.
The most successful creators never stop refining their thumbnails. Build a collection of ideas, experiment consistently, and let your data shape your creative choices. That next thumbnail could be the breakthrough your channel needs to gain even more traction.
FAQs
What are some effective ways to improve my YouTube thumbnail CTR?
To improve your YouTube thumbnail click-through rate (CTR), focus on crafting eye-catching designs that demand attention. Use bold, high-contrast colors, clear, relevant images, and large, readable text to ensure your thumbnail pops, even in a crowded feed.
Another effective tactic is A/B testing, which allows you to test different thumbnail designs and see what connects best with your audience. Try experimenting with various elements like color schemes, text placement, and imagery to discover the most effective combination. Tools such as ThumbnailCreator can make this easier by providing AI-generated designs and customizable templates, helping you create professional, attention-grabbing thumbnails with minimal effort.
How does traffic source affect your video's CTR?
Traffic sources play a big part in shaping your video's click-through rate (CTR) because they influence how viewers come across your content. Whether it's through YouTube recommendations, search results, or external links, each source brings a different level of viewer intent and engagement - and that can impact how effective your thumbnail needs to be.
For instance, a thumbnail that grabs attention in search results may not work as well for recommended videos, where viewers are often scrolling more casually. By breaking down your CTR by traffic source, you can pinpoint which thumbnails work best for specific audiences and adjust your designs accordingly. This focused strategy can make a noticeable difference in how well your video performs overall.
Why is A/B testing important for YouTube thumbnails?
A/B testing is a game-changer for YouTube creators when it comes to thumbnails. It allows you to test different designs to see which one grabs more attention and drives a better click-through rate (CTR) - arguably one of the most important metrics for video performance.
Instead of relying on guesswork, this method gives you clear, data-backed insights into what works best for your audience. Over time, tweaking your thumbnails based on these results can lead to noticeable boosts in video performance, helping your channel grow and reach a wider audience. And with YouTube now offering native A/B testing tools, optimizing your thumbnails has never been simpler.