

YouTube CTR Benchmarks 2026
YouTube says half of all channels and videos have an impressions CTR between 2% and 10% - but that isn’t a target. I recommend comparing your latest 10–20 similar uploads, matching traffic source and video age, then using their median CTR as your baseline.
That official range isn’t a dated 2026 study or a niche average. It measures clicks from eligible thumbnail impressions, not every exposure to your video.
Here’s how I’d use it:
- Compare like with like: Separate Search, Home, and Suggested traffic, and keep Shorts apart from long-form videos.
- Check viewing results: Read CTR alongside impressions, retention, and watch time.
- Test one change at a time: Keep the title fixed when testing a thumbnail. Tools such as ThumbnailCreator can help make variants, but they don’t prove which one works.
My rule: <u>Judge clicks and viewing together</u>. More clicks don’t tell the whole story if viewers leave sooner.
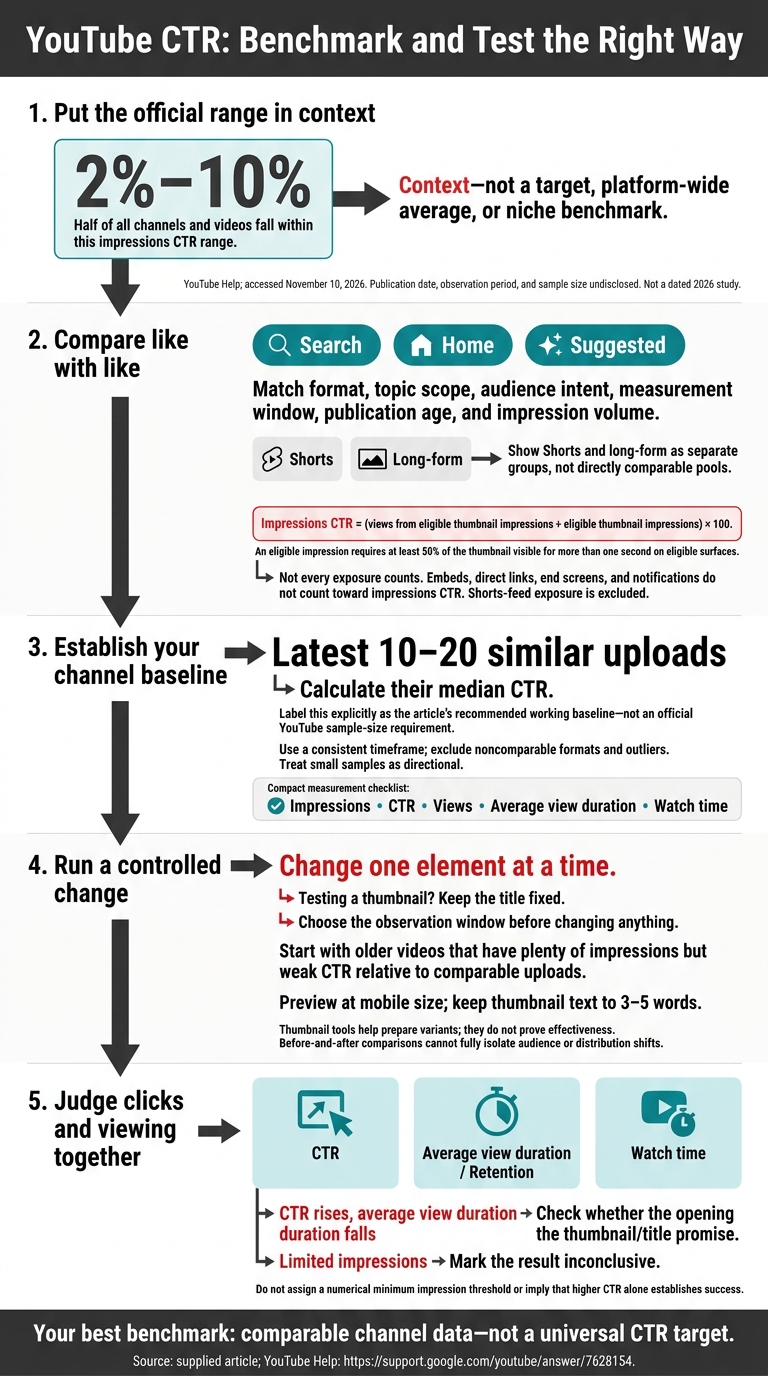
YouTube CTR: Benchmark and Test the Right Way
What YouTube’s 2%–10% CTR Range Means
YouTube’s 2%–10% CTR range is not a platform-wide average or a niche benchmark. It’s official guidance on eligible thumbnail impressions, giving you context for comparison. However, if your numbers fall below this range, you may be making common thumbnail mistakes that suppress your reach.
Official Guidance vs. Third-Party Averages
Before using a CTR benchmark, check its source, sample, and method. These details help you judge what the number tells you - and whether it applies to your channel.
| Source type | Population | What it discloses | How to use it |
|---|---|---|---|
| Official YouTube guidance | YouTube channels and videos | No detailed sample description or niche breakdown | Broad platform reference |
| Third-party average with disclosed methods | Defined sample of channels or videos | Sample selection, dates, CTR definition, traffic sources, and calculation | Benchmark for the studied population |
No third-party average is cited here because the supplied material doesn’t verify one. Reject claims that leave out sample, date, or method details.
Also, check how the average was calculated. Does it report a mean or median? Does it average individual video rates or weight the results by impressions? Those choices can produce different results.
Source Dates and Data Limits
The YouTube Help source was accessed on November 10, 2026, but it provides no publication date, observation period, or sample size.
When logging a benchmark, record the access date separately from the measurement date. Mark any undisclosed dates as unknown. Without that context, don’t call the figure a 2026 study or a current benchmark.
Interpreting CTR also requires knowing how YouTube counts impressions.
sbb-itb-b59debf
How YouTube Calculates Impressions CTR
Impressions CTR = (views from eligible thumbnail impressions ÷ eligible thumbnail impressions) × 100. Any benchmark needs to account for traffic source and video age.
Impressions, Views, and Watch Time
YouTube counts an impression when at least 50% of a thumbnail is visible for more than one second on eligible surfaces, such as Home, Search, and Subscriptions. Views from embeds, direct links, end screens, and notifications count as views, but don’t count toward impressions CTR.
For benchmarks to work, compare the same impression type.
| Metric | What it tells you |
|---|---|
| Impressions CTR | A high rate based on few impressions can mislead |
| Average view duration | Short viewing may point to unmet expectations |
| Watch time | Total viewing time alone doesn’t establish satisfaction |
CTR by Format and Traffic Source
CTR changes by format and traffic source. Search viewers arrive with intent, while viewers on Home and Suggested are browsing.
| Format | Where impressions CTR applies | Main limit |
|---|---|---|
| Long-form videos | Eligible thumbnail placements on YouTube | Not all exposures count |
| Shorts | Eligible thumbnail placements outside the Shorts feed | Shorts-feed exposure is excluded |
A blended CTR can hide large differences between traffic sources.
When CTR Comparisons Mislead
Compare CTR only when format, traffic source, time window, publication age, impression volume, and audience match. In YouTube Studio, separate traffic sources before interpreting a change.
| Comparison | Why CTR can mislead | Better comparison |
|---|---|---|
| New uploads vs. evergreen videos | Early exposure differs from long-term discovery | Match publication age and measurement window |
| Narrow topics vs. broad topics | Audience familiarity differs | Match topic scope and audience |
| Search-heavy vs. recommendation-heavy traffic | Search intent differs from browsing | Compare the same traffic source |
Apply these filters before you set a channel baseline.
Set a Channel Baseline and Test Thumbnail Changes
Use your own channel data to set a working baseline, starting with videos that have comparable traffic and publication age.
Group Similar Videos and Calculate Your Baseline
Build your baseline from your latest 10–20 similar uploads. Tag their thumbnails by colors, expressions, and layouts to spot patterns within each group.
| Measurement field | What to record |
|---|---|
| Data source | YouTube Studio Reach report and exported Analytics data |
| Analysis period | Latest 10–20 comparable uploads from a consistent timeframe |
| Inclusion criteria | Similar format, topic, audience intent, traffic source, and publication age |
| Exclusions | Outliers and formats that aren't comparable, such as Shorts vs. long-form |
| Sample size | Number of videos analyzed; treat small samples as directional |
| Metrics | Impressions, CTR, views, average view duration, and watch time |
| Baseline | CTR benchmark for comparable videos |
Use this baseline as the reference point for each thumbnail and title test.
Track Thumbnail and Title Tests
Treat the thumbnail and title as a pair. The thumbnail provides the visual hook; the title adds context. Record both versions, dates, observation window, impressions, CTR, views, average view duration, and watch time. Change one element at a time, keeping the other fixed. This makes results easier to interpret, though a before-and-after comparison still can't fully separate the effects of audience or distribution shifts.
Start with older videos that have plenty of impressions but weak CTR compared with similar uploads. Choose your observation window before making a change, then review clicks alongside viewing outcomes. If CTR goes up but average view duration drops, check whether the opening delivers what the revised thumbnail and title promise. When impressions are limited, mark the result inconclusive rather than calling it a winner.
Use those underperforming videos to guide the next batch of cleaner thumbnail variants.
Prepare Thumbnail Variants with ThumbnailCreator
Use ThumbnailCreator’s AI generation and editing features to draft controlled variants. Preview each at mobile size, keep text to 3–5 words, and check that faces, objects, and text match the video. Test each variant against your channel baseline.
| Area | Advantage | Limitation |
|---|---|---|
| Iteration | AI generation and face or object swaps help prepare different visual hooks | Faster production doesn't guarantee higher CTR |
| Visual consistency | Templates and text editing help maintain a recognizable series style | Consistent styling still needs mobile-readability checks |
| Test variants | Separate assets let you change one visual element at a time | Broad redesigns make individual effects harder to interpret |
| Measurement | Prepared variants can be tracked against your channel baseline | The tool doesn't establish benchmarks or isolate distribution effects |
Conclusion: Benchmark CTR with Comparable Channel Data
Treat YouTube’s 2%–10% range as context, not a target. Before comparing, check the data date, traffic source, and sample size. Your own channel baseline is the most useful benchmark. This data-driven approach is more reliable than A/B testing vs gut feeling when making design decisions.
In YouTube Studio, calculate the median CTR for comparable videos using the same format, traffic source, and post-publication window. Test one thumbnail change at a time, then review results within that same window. Wait until you have enough impressions to judge the results, and assess CTR alongside retention and watch time.
FAQs
How many impressions do I need for a reliable CTR test?
Wait until each thumbnail variant gets 1,000 to 2,000 impressions before drawing conclusions. You may see early signals at 500 impressions, but 1,000 or more is generally considered the standard for results you can act on.
For larger-scale tests, aim for 10,000 impressions for higher statistical significance. Run tests for 7 to 14 days to account for day-to-day performance changes.
Why does my CTR drop as impressions grow?
A lower click-through rate (CTR) is normal as impressions grow. YouTube usually shows your video to your most engaged viewers first. As Browse or Suggested features bring it to a broader, less targeted audience, fewer people may click.
But a sharp drop in CTR may be a cue to use ThumbnailCreator to design a thumbnail that appeals to more viewers.
How can I benchmark CTR on a new channel?
Set your own CTR baseline instead of relying only on platform-wide averages. In YouTube Studio, go to Analytics → Reach to review impressions, then compare CTR across Search, Browse, and Suggested traffic. Wait until you have at least 500 to 1,000 impressions before judging performance.
Use ThumbnailCreator to make click-worthy thumbnails. Then compare your top- and bottom-performing videos to see which layouts, text, and facial expressions connect with your audience.