
Top 7 Tools for Tracking YouTube Engagement Metrics
Want to grow your YouTube channel? Tracking engagement metrics is key. Views alone don’t tell the full story - metrics like likes, comments, shares, watch time, and audience retention help you understand how viewers interact with your content. The right tools can simplify this process by analyzing performance, benchmarking against competitors, and uncovering growth opportunities.
Here are the top 7 tools for tracking YouTube engagement metrics:
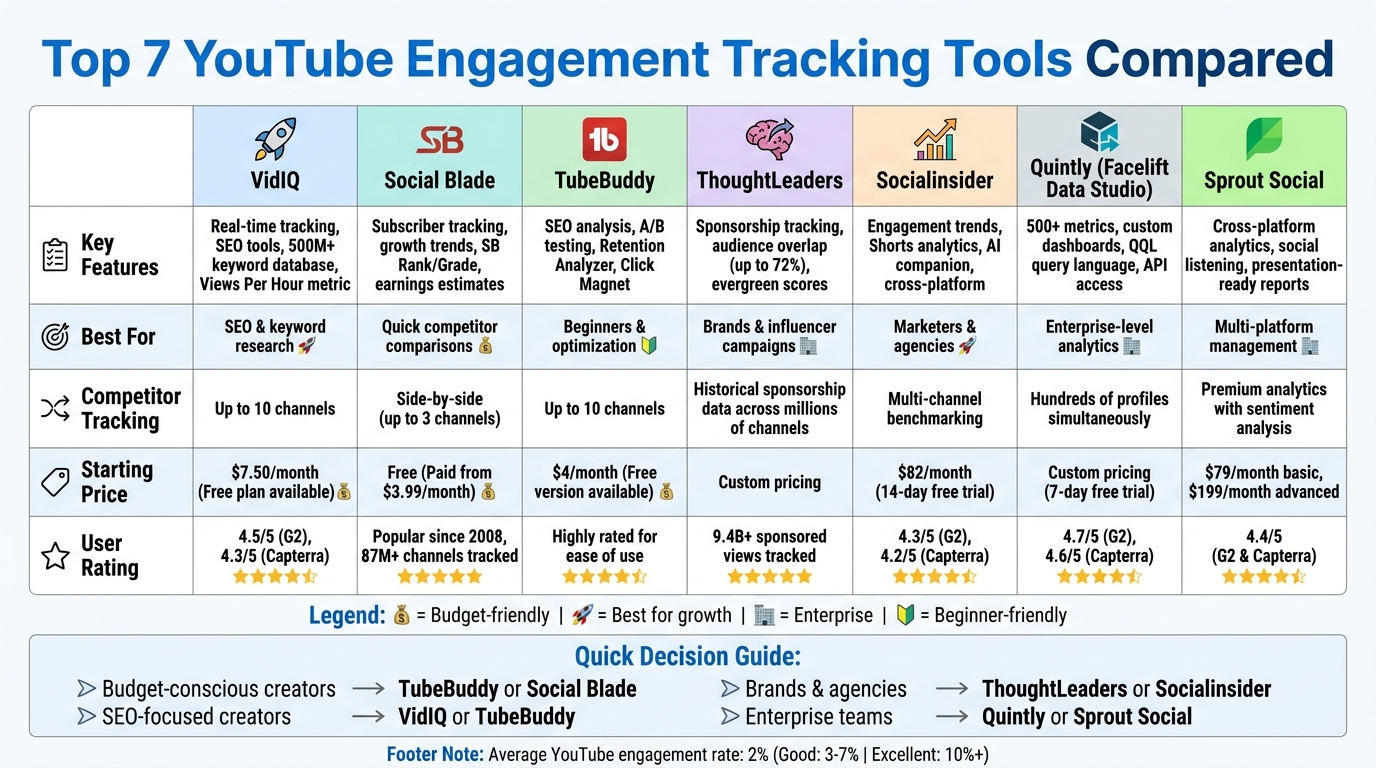
- VidIQ: Tracks views, likes, comments, shares, and SEO scores. Offers competitor tracking and keyword research. Prices start at $7.50/month.
- Social Blade: Focuses on subscribers, total views, and growth trends. Great for quick comparisons. Check out our YouTube thumbnail comparisons for more design insights. Free basic plan, paid plans from $3.99/month.
- TubeBuddy: Integrates directly into YouTube for real-time metrics, SEO analysis, and A/B testing. Free version available; Pro plan starts at $4/month.
- ThoughtLeaders Platform: Designed for brands managing influencer campaigns, with advanced sponsorship and audience overlap analytics. Custom pricing.
- Socialinsider: Combines your channel data with competitor insights, tracking engagement rates and trends. Paid plans start at $82/month.
- Quintly (Facelift Data Studio): Enterprise-level analytics with customizable metrics and dashboards. Custom pricing.
- Sprout Social: Centralizes YouTube and other social platform metrics, with advanced reporting features. Plans start at $79/month.
Quick Comparison:
| Tool | Key Features | Starting Price |
|---|---|---|
| VidIQ | Real-time tracking, SEO tools | $7.50/month |
| Social Blade | Subscriber and growth tracking | Free; $3.99/month |
| TubeBuddy | SEO analysis, A/B testing | $4/month |
| ThoughtLeaders | Sponsorship and audience overlap | Custom pricing |
| Socialinsider | Engagement trends, competitor insights | $82/month |
| Quintly | Custom dashboards, enterprise-level | Custom pricing |
| Sprout Social | Cross-platform analytics | $79/month |
Choose the tool that fits your goals and budget. Whether you’re a beginner or managing multiple channels, these tools can help you turn data into actionable strategies.
YouTube Analytics Tools Comparison: Features and Pricing Guide
BEST YouTube Tools (ViewStats Pro, 1of10, Tubebuddy VIDIQ)
sbb-itb-b59debf
1. VidIQ
VidIQ offers a robust platform designed to track key metrics like views, likes, comments, and shares while delivering detailed insights into your content's performance. A standout feature is its "Views Per Hour" (VPH) metric, which provides real-time updates on how content is trending, helping you identify rising stars in your niche. This combination of real-time tracking and advanced analytics makes it a valuable tool for gaining a competitive edge.
Engagement Metrics Tracked
VidIQ assigns an SEO Score to each video by evaluating elements like tags, titles, and descriptions [3, 8]. For creators diving into short-form content, VidIQ has added analytics for YouTube Shorts, a format that now garners more than 1 billion daily views.
Competitor Analysis Features
VidIQ shines when it comes to competitor analysis. You can track up to 10 competitor channels, analyzing their top-performing videos based on metrics like engagement, titles, and thumbnail mistakes to avoid [6, 11]. The platform also allows for side-by-side performance comparisons over timeframes like 30 days, 60 days, or even a year. Additionally, a one-click export feature for competitor keywords and access to a keyword database with over 500 million terms make it easier to identify trends and uncover content opportunities.
"vidIQ's extension and keyword research tools have helped me discover new opportunities on YouTube." - Ali Abdaal, Creator with 5M Subscribers
The VidIQ Chrome extension further simplifies the process by overlaying real-time performance data directly on YouTube. This includes tags, view velocity, and other key stats like thumbnail CTR benchmarks, eliminating the need to toggle between tabs.
Data Visualization and Reporting
With tools like interactive graphs and the Channel Audit, VidIQ provides clear visual feedback on your content's performance. These tools also allow you to export data for deeper analysis [3, 6]. Visual reports highlight growth patterns and help refine strategies to drive better engagement.
The platform’s "Daily Ideas" engine, powered by AI, suggests new content topics based on historical and current engagement trends. Additionally, trend alerts notify you when certain keywords or competitors begin gaining traction, keeping you ahead of the curve [7, 10].
Pricing and Accessibility
VidIQ offers a free tier with basic features like keyword research and tracking [7, 8]. Paid plans start at $7.50–$10 per month for the Pro plan and range from $19–$39 per month for the Boost plan, which includes advanced tools like the Daily Ideas engine and enhanced competitor tracking. The platform has received high marks from users, with ratings of 4.5/5 on G2 and 4.3/5 on Capterra. While many praise its keyword research tools and Chrome extension, some users find the interface a bit overwhelming at first.
2. Social Blade
Social Blade has been tracking YouTube creator stats since 2008, monitoring 87 million YouTube channels and serving data to 160 million users. It specializes in high-level growth metrics like subscriber counts, total views, and video uploads, making it a go-to tool for quick competitive benchmarking rather than in-depth engagement analysis.
Engagement Metrics Tracked
Social Blade focuses on subscribers, total views, and video uploads, offering a broader view of channel performance rather than diving into detailed engagement data. It provides features like "Video Stats" and "Creator Stats", along with unique metrics such as SB Rank/Grade and estimated earnings [12, 14]. While it’s great for tracking overall growth, it doesn’t offer deeper insights like watch time, audience retention, or demographic breakdowns, which are often crucial for creators fine-tuning their content. Additionally, metrics for likes, comments, and shares are absent, but the platform’s high-level data is still a valuable resource for competitive analysis.
Competitor Analysis Features
One of Social Blade’s standout features is its side-by-side comparison tool, which allows users to compare up to three channels at once. This feature enables creators to see how they rank globally, by country, or within specific categories like Entertainment [13, 16]. For instance, as of May 2026, MrBeast leads the platform with over 482 million subscribers and 120.2 billion views. The Query Builder helps filter niche creators, while future projections predict milestones based on current growth trends [12, 16].
Data Visualization and Reporting
Social Blade enhances its analytical tools with clear data visualizations. Its browser extension integrates key stats directly into YouTube and Twitch interfaces. Users can explore historical charts and real-time subscriber counters, which are particularly useful for spotting trends during viral moments. However, it’s worth noting that YouTube has warned about potential delays in real-time data updates when using third-party tools.
Pricing and Accessibility
A free account on Social Blade provides instant access to basic analytics for any creator, no login required. Upgrading to paid accounts removes ads and expands features like favorites lists and top lists. For businesses, the Business API tier allows for seamless integration of Social Blade data into internal systems. While users appreciate the platform’s convenience for checking public stats, many find its revenue estimates too general to rely on for precise earnings predictions [16, 17].
3. TubeBuddy
TubeBuddy is a browser extension that integrates directly into YouTube, giving creators instant access to engagement data. It tracks metrics like likes, dislikes, comments, views, subscriber growth, and upload frequency - not just for your own channel, but also for your competitors. Beyond YouTube, it also monitors external engagement, such as mentions and upvotes on platforms like Reddit and X (formerly Twitter), offering a broader perspective on video performance.
Engagement Metrics Tracked
TubeBuddy's Videolytics tool overlays real-time engagement data directly onto YouTube video pages. This includes SEO scores and tag analysis. The Retention Analyzer pinpoints the exact moments where viewers drop off or stay engaged. On top of that, the Click Magnet feature identifies patterns in Click-Through Rates (CTR), helping you understand what elements drive viewers to click on your videos. By combining surface-level metrics with deeper behavioral insights, TubeBuddy equips creators with actionable data to improve both content and presentation.
Competitor Analysis Features
The Competitor Scorecard allows you to compare your channel against up to 10 competitors, tracking metrics like lifetime views, subscriber growth, and recent engagement. With the Channelytics tool, performance data - such as 30-day growth trends and upload frequency - automatically loads when you visit a competitor's YouTube page. Additionally, Competitor Upload Alerts notify you via email, text, or in-app messages whenever a rival uploads new content, allowing you to stay on top of trends and respond quickly.
"TubeBuddy is VITAL for any YouTuber who is serious about making their channel a lucrative side-hustle or full-time job!" - Danie Jay
Data Visualization and Reporting
TubeBuddy simplifies performance tracking by integrating its insights directly into YouTube Studio. Reports are accessible through a Scorecard tab or as overlays on YouTube channels. The Videolytics overlay highlights SEO scores, while Channelytics provides a snapshot of the past 30 days' performance trends. This seamless integration eliminates the need to juggle multiple analytics tools or export data into separate dashboards.
Pricing and Accessibility
TubeBuddy offers a range of plans to suit different needs. The Free plan provides essential tools like Videolytics, SEO analysis, and basic competitor tracking. The Pro plan, starting at $4/month (or $3.20/month with annual billing), includes enhanced optimization features. For more advanced tools like A/B testing vs gut feeling analysis, Click Magnet, and multi-competitor tracking, the Legend plan is available. Larger teams can opt for the Enterprise plan, which offers custom pricing and unlimited competitor tracking.
"Once it got my videos ranking #1 in search I was hooked" - Karl Oftebro
4. ThoughtLeaders Platform
The ThoughtLeaders Platform is tailored for brands and agencies managing influencer campaigns. Unlike tools designed for individual creators, this platform processes data from millions of YouTube channels daily. Its goal? To help brands pinpoint the right creators and monitor campaign performance effectively. It transforms raw data into actionable strategies that drive YouTube engagement. This includes optimizing visual elements to get more views through higher click-through rates.
Engagement Metrics Tracked
The platform tracks key engagement rates while also diving into more advanced metrics like evergreen scores. These scores measure how long a video continues to attract views and engagement after its initial upload. Other tracked metrics include total views, projected views, and sponsorship history, helping you assess creators based on consistent performance rather than fleeting viral success.
One standout feature is the audience overlap tool. It calculates shared audience percentages, with AI-powered matching revealing overlaps as high as 72%. Together, these metrics provide a solid foundation for evaluating competitors and refining your campaign strategies.
Competitor Analysis Features
ThoughtLeaders excels at competitor analysis by tracking historical sponsorships across millions of YouTube channels. You can see which brands have partnered with specific creators, analyze the outcomes of those collaborations, and use filters to dive deeper into sponsorship history and content performance. This data-driven approach eliminates guesswork, letting you base decisions on actual performance metrics from competitor campaigns.
The platform also offers clear visual insights to make data interpretation easier.
Data Visualization and Reporting
Real-time dashboards provide a snapshot of views, CPV (cost per view), conversions, and ROI. ThoughtLeaders has tracked over 9.4 billion sponsored views and facilitated more than $50 million in creator deals across 25,000+ collaborations. Users can build custom campaign reports, while the platform generates polished, executive-ready summaries for stakeholder presentations.
You’ll also receive real-time notifications to stay updated on campaign milestones and ensure view guarantees are met.
"ThoughtLeaders has made our integration campaign considerably easier. With their help, we were not only able to place ads where they were most effective, but we were able to gain valuable data while we were at it." - Lane Wagner, Founder, Boot.dev
Pricing and Accessibility
ThoughtLeaders offers a free signup option for exploring the platform. However, pricing details aren't publicly available. Interested users can schedule a strategy call to receive custom pricing tailored to their needs. The platform caters to brands, talent managers, and media buying agencies, offering both a self-service intelligence tool and managed media services. Additionally, it provides an API for seamless integration into your existing tech stack.
5. Socialinsider
Socialinsider merges your channel data with competitor insights, making it a go-to tool for marketers and agencies looking to track engagement while also keeping tabs on competitors. Unlike YouTube Studio, which focuses solely on your own metrics, Socialinsider offers a broader perspective, helping you benchmark against public channels and monitor long-term trends. This approach provides a detailed look at how each channel is performing.
Engagement Metrics Tracked
Socialinsider tracks key engagement metrics like likes, comments, and shares. It calculates engagement rate per post by adding up likes and comments, then dividing by both the number of recent posts and total subscribers. Additional metrics include total organic engagement, average views per post, and posting frequency.
The platform also features a dedicated Shorts view to separate short-form from long-form engagement. This distinction is vital since these formats operate under different algorithms and audience behaviors. Another useful feature is tracking subscriber growth and loss trends, allowing you to link these changes to specific upload dates.
Competitor Analysis Features
With Socialinsider, you can benchmark your performance against competitors through side-by-side comparisons of engagement trends, subscriber growth, and posting frequency. The head-to-head comparison tool allows for direct metrics comparison between two channels over a 30-day period. For example, a June 2025 analysis showed Disney achieving a 0.13% engagement rate and 8,317 average likes per post, compared to HBO's 0.03% engagement rate and 752 likes.
The tool also helps uncover content gaps by showing industry benchmarks and highlighting areas where competitors may be falling short.
"The competitor analysis helped in creating visibility on how we are performing in the market" - Victor Mukubvu, Digital Marketing Analyst at Mitsubishi Electric
These benchmarking tools make it easier to identify opportunities and refine strategies. For creators managing multiple channels, testing thumbnails at scale can further optimize these engagement opportunities.
Data Visualization and Reporting
Socialinsider simplifies data interpretation with automated reporting features that save significant time.
"On average, a social media report for a brand requires 1 to 2 hours of work with Socialinsider, where it used to require a full day to gather the data" - Dorra Lunet from Hanging Gardens Agency
Reports can be exported in various formats, including PDF, PPT, CSV, or Excel, with options to customize logos and colors.
Additionally, an AI companion allows users to perform complex analyses through conversational queries, eliminating the need for manual filtering.
"Socialinsider has saved us more than $16k per year. It has enabled us to save time on monthly reports and complex long-term analyses" - Mohamed El-Daly from Create Media
Pricing and Accessibility
Socialinsider offers a 14-day free trial, allowing users to analyze up to 20 profiles. Paid plans start at $82 per month when billed annually (or $99 monthly) for 10 social profiles. The Optimize plan costs $149 per month (billed annually) and covers 30 profiles with 3 user seats, while the Predict plan, priced at $239 per month (billed annually), includes 40 profiles, API access, and white-label reporting.
The platform has received positive feedback, with a 4.3/5 rating on G2 and 4.2/5 on Capterra.
6. Quintly
Quintly, now known as Facelift Data Studio, is designed for those who need advanced, customizable analytics at an enterprise level. Unlike basic tracking tools, this platform is built to handle performance monitoring across hundreds of YouTube profiles, offering access to over 500 social media metrics. It's tailored specifically for enterprise users, providing a deeper level of insight. Let’s break down what makes it stand out.
Engagement Metrics Tracked
Facelift Data Studio tracks essential YouTube metrics like engagement rates, views, watch time, and subscriber growth. It also dives into video-level performance and tracks mentions in posts and comments. What sets it apart is its proprietary query language (QQL), which allows data specialists to create custom metrics and datasets that align with their unique strategies.
Competitor Analysis Features
The platform excels at benchmarking your channel against competitors by using both public and private data sources. With the ability to track hundreds of profiles simultaneously, it provides a bird’s-eye view of market trends. The QQL feature adds another layer of precision, enabling highly specific competitive analyses that many standard tools lack. Automated reporting is another plus, letting you schedule reports in formats like PDF, PPT, CSV, or Excel for seamless sharing.
Data Visualization and Reporting
Facelift Data Studio offers a wealth of customizable dashboards and automated reporting tools to present KPI insights in a variety of formats. For advanced users, API integration is available, making it possible to transfer YouTube engagement data directly into external business intelligence platforms, such as Google Big Query. User feedback highlights its flexibility, with ratings of 4.7 stars on G2 (from 68 reviews) and 4.6/5 on Capterra (from 8 reviews). While users appreciate its adaptability, some mention a steeper learning curve and note the absence of built-in SEO features like keyword research or optimizing thumbnails for authenticity.
Pricing and Accessibility
Facelift Data Studio operates on a custom pricing model and offers a 7-day free trial for new users. Its enterprise-oriented design makes it an excellent choice for large brands, marketing agencies, and media companies that need scalable reporting across multiple social platforms.
7. Sprout Social
Sprout Social, powered by advanced analytics from Quintly, provides a centralized dashboard that merges YouTube data with metrics from other social platforms. This all-in-one social media management tool is designed for YouTube creators and marketing teams aiming for seamless performance tracking across channels. With ratings of 4.4/5 on G2 (from 6,437 reviews) and Capterra (from 604 reviews), it’s a reliable choice for teams looking to manage YouTube analytics alongside broader social media insights in a single interface. Its standout features include a user-friendly visual reporting system and tools for comparing performance across networks.
Engagement Metrics Tracked
Sprout Social tracks all key YouTube interactions - likes, dislikes, comments, and shares - along with more specific actions like post link clicks and video-related interactions (e.g., card clicks and teaser impressions). It calculates overall engagement by summing up reactions, comments, shares, and clicks. Beyond these basics, it also measures average view duration, audience retention curves, and subscriber changes for individual videos. These insights help determine which content boosts channel growth and which might lead to audience drop-offs.
Competitor Analysis Features
With its Social Listening and Premium Analytics tools, Sprout Social enables you to benchmark your channel against competitors. It tracks metrics such as average views per video, posting frequency, and engagement rates. Additionally, you can analyze competitors’ video lengths, keyword strategies, and comment sentiment. These features provide a clearer picture of market trends and help identify opportunities to improve your content strategy.
Data Visualization and Reporting
The YouTube Videos Report offers a visual grid that pairs YouTube thumbnails with key performance metrics, making it easy to spot your best-performing content at a glance. Sprout Social also integrates YouTube data into cross-platform reports like Profile Performance, Post Performance, and Tag Performance, allowing for direct comparisons with other social networks. Premium Analytics provides presentation-ready exports, aligning YouTube data with business objectives and ROI. However, some users have noted a 36–48 hour delay for certain reports. These tools are designed to meet the needs of diverse teams, offering flexible pricing options.
Pricing and Accessibility
Sprout Social’s advanced analytics features start at $199 per month per user (as of early 2026), while its basic professional tools are available for $79 per month. New users can take advantage of a 30-day free trial to explore the platform. While the advanced features come at a higher cost, the platform’s robust reporting and collaboration tools make it a worthwhile option for agencies and brands managing multiple social media channels.
Comparison Table
Choosing the right analytics tool depends on your budget, experience level, and specific channel goals. Below is a summary of how various platforms perform in tracking engagement metrics, analyzing competitors, and their pricing options. The table and insights that follow provide a clear breakdown of key features and practical considerations.
| Tool | Engagement Metrics Tracked | Competitor Analysis Capabilities | Starting Price |
|---|---|---|---|
| VidIQ | Likes, comments, shares, subscribers, watch time, CTR, average view duration, audience retention | Browser extension overlays competitor data directly on YouTube; tracks view velocity, upload frequency, top-performing tags, and uses a 500M+ keyword database for trend scoring | Free basic plan; $16.58/mo (annual) or $19/mo |
| Social Blade | Likes, dislikes, comments, shares, subscriber growth, historical performance data | Public competitor stats like subscriber growth projections, historical data, and Channel Grade (A++ to D–); lacks deeper content insights | Free for basic stats; Bronze at $3.99/mo or $4.50/mo |
| TubeBuddy | Likes, comments, shares, subscribers, watch time, impressions, CTR, average view duration | Browser extension with competitor tag analysis, upload frequency tracking, performance benchmarking, and A/B testing for thumbnails and titles | Free version available; Pro at $2.80/mo (annual) or $4.99/mo |
| Socialinsider | Likes, comments, shares, subscribers, engagement rate, watch time, impressions, CTR | Multi-channel benchmarking with performance comparison reports and content strategy insights | Free benchmarking tool; full plans start at $83/mo |
| Quintly | Likes, dislikes, comments, shares, subscribers, watch time, CTR, custom KPIs via QQL | Advanced benchmarking with custom dashboards and highly customizable data queries, though it has a steeper learning curve | Custom pricing upon request |
| Sprout Social | Likes, dislikes, comments, shares, post link clicks, card clicks, teaser impressions, average view duration, audience retention, subscriber changes | Social listening and premium analytics for benchmarking; tracks average views per video, posting frequency, engagement rates, keyword strategies, and comment sentiment | $199/mo per user for advanced analytics; $79/mo for basic professional tools |
Each platform offers something different to meet specific needs. VidIQ and TubeBuddy are excellent for creators focused on SEO and optimization. VidIQ stands out with its extensive keyword research tools, while TubeBuddy offers robust A/B testing capabilities. Social Blade is a go-to for basic competitor tracking with easy access to public stats. For enterprise teams managing multiple platforms, Sprout Social provides detailed cross-platform reporting, and Quintly excels with its customizable dashboards for in-depth benchmarking.
To give some perspective, the average YouTube engagement rate hovers around 2%, with 3–7% being solid and anything above 10% considered outstanding. Most tools calculate engagement using this formula:
((Total likes + comments + shares + subscribers) / Total views) × 100
As the analytics landscape evolves, there's a growing emphasis on predictive analytics to anticipate competitor strategies rather than just reviewing past data . For creators on a tight budget, YouTube Studio paired with Social Blade's free tier can provide a combination of official and competitor data. Meanwhile, TubeBuddy offers a 50% discount on its Pro plan for creators with under 1,000 subscribers, making it a budget-friendly choice for beginners .
Conclusion
Tracking YouTube engagement metrics gives creators a clearer view of the competitive landscape while highlighting areas others might overlook. With 78% of marketing teams now keeping a close eye on competitor channels, blending internal analytics with competitor insights has become a key strategy for success.
The right tools can make all the difference. If you're working with a tighter budget, YouTube Studio and Social Blade's free tier are good starting points. Those looking for affordable upgrades might consider TubeBuddy's Pro plan at just $3.60 per month. For creators focused on SEO, both VidIQ and TubeBuddy offer strong keyword and tag analysis features. Meanwhile, platforms like Socialinsider and Quintly provide deeper dives into competitive data.
"The best YouTube trackers in 2026 don't just tell you your numbers - they tell you where the opportunity is before your competitors see it." – Zach Sanders, Head of Growth, ContHunt
One game-changing trend is the rise of predictive analytics, which shifts focus from analyzing past performance to anticipating what competitors will do next. Metrics like view velocity - how many views a video gets in the first 48–72 hours - are now more important than overall view counts. Setting up automated alerts can also help you stay on top of competitor uploads or trending keywords.
Your next step? Choose a tool that directly addresses your biggest challenge, whether that's SEO, competitor monitoring, or managing multiple platforms. As your channel grows, layer additional tools to build a more powerful analytics stack. This approach ensures you're always ready to adapt to new trends and stay one step ahead.
FAQs
Which YouTube engagement metrics matter most for growth?
Key YouTube engagement metrics that drive growth include watch time, retention, click-through rate (CTR), as well as likes, comments, shares, and audience demographics. These numbers reveal how viewers interact with your content and offer insights to fine-tune your videos for stronger engagement and channel success.
How can I accurately benchmark my channel against competitors?
Tracking metrics like views, engagement, and content trends is essential for understanding your position in the YouTube landscape. Specialized tools such as OutlierKit, VidIQ, TubeBuddy, and Social Blade make this process much easier by offering detailed insights into subscriber growth, engagement rates, and areas where competitors might be outperforming you.
By focusing on these metrics, you can pinpoint opportunities to improve your content, refine your strategies, and stay ahead of the competition. Some advanced tools even include predictive analytics, helping you anticipate future trends and benchmark more effectively.
Do I need a paid tool if I already use YouTube Studio?
YouTube Studio offers free analytics, including subscriber counts, watch time, engagement metrics, and audience demographics - plenty for basic channel tracking. But if you're looking for more advanced tools, paid options can provide features like competitor analysis, trend forecasting, and content optimization. If you're aiming to fine-tune your strategy or stay ahead of competitors, a paid tool could be a smart investment. Otherwise, YouTube Studio might already cover the essentials for your needs.