
How Competitor CTR Impacts Your YouTube Strategy
Every time your video appears on YouTube, it’s competing with dozens of others for clicks. The key to standing out? Click-through rate (CTR). A higher CTR signals YouTube’s algorithm to promote your video more widely, potentially boosting views by 20–30% with just a 1% increase in CTR.
Here’s the catch: YouTube doesn’t share competitor CTR data directly. But by studying indicators like view velocity, engagement ratios, and standout thumbnails, you can identify what works in your niche. Competitor analysis reveals trends - like the use of expressive faces or bold text in thumbnails - that drive clicks. Testing these elements on your own content can lead to measurable improvements.
Key Takeaways:
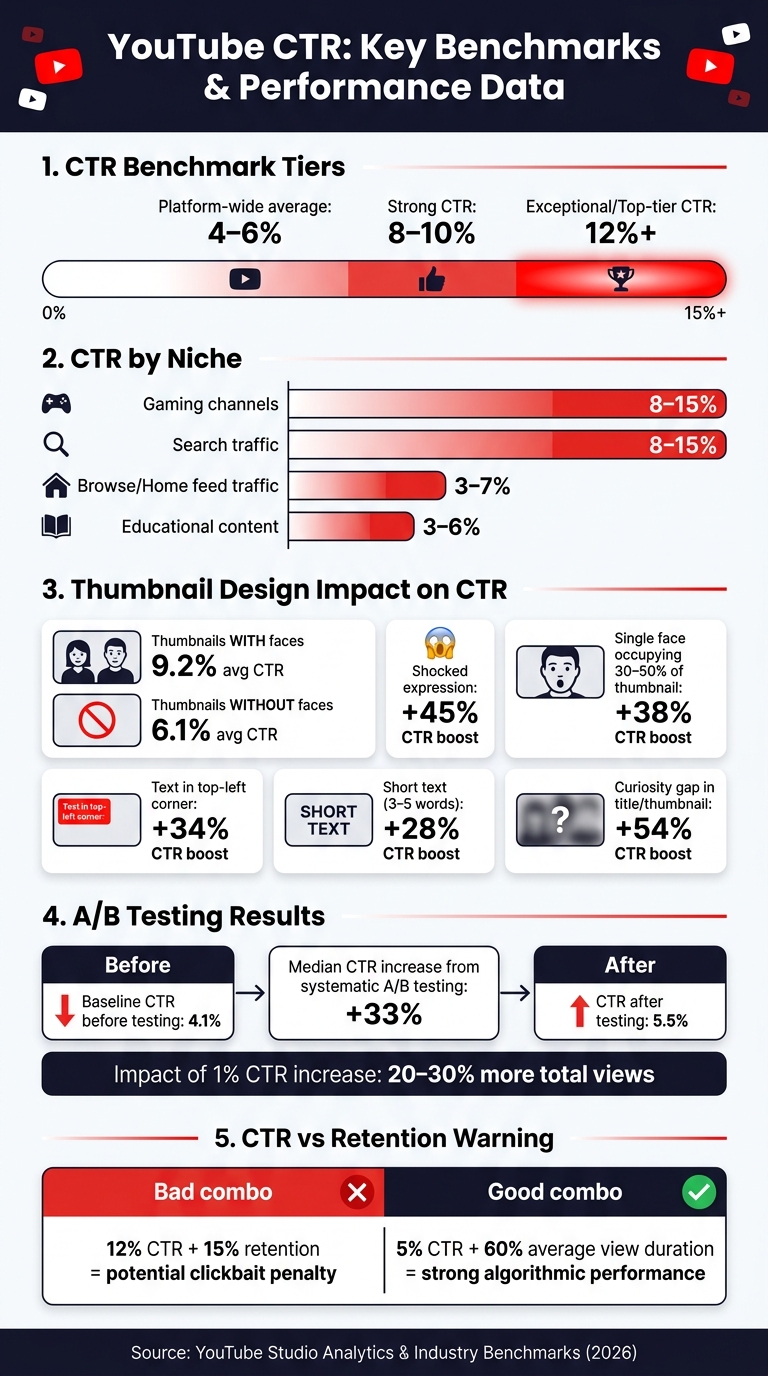
- CTR benchmarks vary by niche: 8–10% is strong; above 12% is exceptional.
- Engagement proxies like view velocity and like/comment ratios hint at strong CTR.
- Thumbnails with faces perform better, averaging 9.2% CTR compared to 6.1% without.
- Use tools like YouTube’s Test & Compare to experiment with thumbnail designs.
Focus on analyzing patterns, testing updates systematically, and refining based on results. Even small changes, like thumbnail tweaks, can have a big impact on your channel’s growth.
YouTube CTR Benchmarks & Thumbnail Performance Stats
Understanding Competitor CTR and How It Shapes Your Strategy
What CTR Is and Why It Matters
Click-through rate (CTR) measures the percentage of viewers who click on your video after seeing its thumbnail. It’s calculated by dividing clicks by impressions and multiplying by 100.
As of 2026, the platform-wide average CTR ranges between 4–6%. A strong CTR typically falls in the 8–10% range, while anything above 12% is considered top-tier. However, these benchmarks vary by niche. For instance, gaming channels often achieve 8–15%, whereas educational content tends to hover around 3–6%, as viewers in this niche usually click only when the video directly addresses their query.
CTR also depends on where your video is discovered. Search traffic tends to convert at 8–15% since viewers are actively searching for content. On the other hand, browse traffic (like the home feed) usually sees lower CTRs, around 3–7%, as users are passively scrolling.
In 2026, YouTube has introduced "Quality CTR", which factors in not just the click but also whether viewers stick around for at least 30 seconds.
"A video with 10% CTR but 80% drop-off in the first 30 seconds is now actively worse than a video with 5% CTR and 60% retention." - Hooksnap Blog
Understanding CTR helps you interpret how high-performing competitor videos signal audience preferences and engagement.
How Competitor CTR Reveals Audience Preferences
Competitor CTR provides valuable insights into what content and visuals resonate with your shared audience. When a competitor’s video significantly outperforms their usual metrics, it’s often due to effective packaging - like a compelling thumbnail, title, or unique angle.
By observing which videos in your niche garner unusually high views, you can pinpoint patterns in visual and content strategies that attract clicks. For example, fitness videos often succeed with before/after split thumbnails, while finance content tends to perform better with number-driven titles like "I Saved $10,000 in 6 Months". These trends aren’t random - they reflect repeatable strategies.
Thumbnails featuring expressive faces consistently drive higher CTRs. On average, face-forward thumbnails achieve a CTR of around 9.2%, compared to 6.1% for designs without faces. This pattern holds true across various niches, signaling the universal appeal of relatable and engaging visuals.
The Limits of Competitor CTR Data
Here’s the challenge: YouTube doesn’t provide competitor CTR data. You can’t directly access another channel’s click-through rates. Instead, you have to rely on indirect indicators like view counts, video rankings, engagement metrics, and how quickly a video gains views post-upload.
But be cautious - view counts alone can be misleading. A video with millions of views might owe its success to a large subscriber base rather than strong algorithmic performance. As Denzil from YTGrowth explains:
"Subscriber count is a historical record... It tells you nothing about what the algorithm is doing with that channel this month."
The source of traffic also complicates things. A competitor’s video may excel in Search traffic but underperform in Browse, requiring entirely different thumbnail and title strategies. Without knowing the exact breakdown of traffic sources, mimicking their approach blindly could lead to wasted effort. Instead, focus on understanding why their strategy worked and adapt it to your own content.
sbb-itb-b59debf
How to Find and Analyze Competitor CTR Proxies
Using YouTube's Platform to Spot CTR Proxies
To identify CTR proxies, start by looking for outlier videos - those that perform 3–10 times better than a channel's average view count. When a video exceeds this baseline, it’s a sign that YouTube's algorithm heavily promoted it through Browse and Suggested feeds. This typically reflects a high-performing combination of thumbnail and title that converted impressions into clicks.
Pay attention to where these outliers appear. Videos that frequently show up in Search suggest strong keyword alignment. On the other hand, those dominating Home or Suggested feeds indicate that their packaging - just the thumbnail and title - was enough to grab attention from casual scrollers. Browse and Suggested outliers are particularly valuable to analyze because they highlight CTR performance without being influenced by search demand.
Another useful tool is the "Channels your audience watches" section in YouTube Studio. This feature reveals competitors who are already attracting your viewers, even if they don’t rank highly in keyword research. These insights provide a solid foundation for digging deeper into engagement metrics.
Using Engagement Metrics as CTR Indicators
Since YouTube doesn’t provide direct CTR data, engagement metrics can serve as effective stand-ins. View velocity - the speed at which a video gains views in its first 24–48 hours - is one of the most telling indicators. A fast view velocity often signals strong early CTR and algorithmic promotion.
Focus on these two key engagement ratios to gauge performance:
| Metric | Formula | Healthy Benchmark |
|---|---|---|
| Like Ratio | Likes/View | 3–7% |
| Comment Ratio | Comments/View | 0.5–2% |
High ratios in these areas suggest that the video’s packaging resonates with its audience.
Also, keep an eye out for thumbnail swaps. If a creator changes their thumbnail within the first 24–48 hours of posting, it’s a clear indicator that their initial CTR didn’t meet expectations. Monitoring these changes on competitor channels can reveal what designs or approaches aren’t working in your niche.
Once you’ve identified CTR proxies and engagement metrics, organize your findings for deeper analysis.
Building a Framework to Track Competitor Patterns
Finding one high-performing video is helpful, but identifying patterns across multiple competitors is where the real value lies. Select 5–7 channels that fall into three categories: direct competitors, aspirational channels, and up-and-coming creators.
Create a simple tracking table for each channel. Log details such as:
- Title formulas (e.g., "X Mistakes", "How I...", "Why You Should...")
- Thumbnail elements (e.g., presence of a face, text length, dominant colors)
- Outlier multiples (top video views divided by the channel's average views)
Over time, recurring themes will emerge. These patterns can directly inform your own thumbnail designs and content strategies.
"A fan consumes. A strategist extracts patterns." - OverseerOS
Once you’ve gathered enough data, dive into the comment sections of these standout videos. Look for unanswered questions or requests like "Can you do a video on..." or "What about...". These comments are goldmines for discovering topics your audience craves but your competitors haven’t covered yet.
How to Apply Competitor CTR Insights to Your Strategy
Spotting Patterns in Competitor Success
Once you've set up your tracking framework, it's time to dive into the details. Compare the top 20 thumbnails from each of your monitored channels side by side. Look for recurring design elements - things like dominant colors, the use of faces, specific text styles, or the overall emotional tone.
Different traffic sources reveal different strengths. For example, videos that perform well on Browse or Suggested feeds owe much of their success to their packaging. This makes their thumbnail and title formulas worth analyzing and adapting. On the other hand, Search-driven videos offer more context for testing thumbnail designs rather than direct visual inspiration.
"Competitor analysis serves as a hypothesis framework rather than a template." - Ryan Callahan, Lead Software Engineer, WildandFree Tools
These observations help you align your visuals with audience preferences that have already been proven to work.
Matching Your Content to Audience Demand
After identifying successful patterns from competitors, it's time to see how your own content stacks up. Start by reviewing your YouTube Studio CTR metrics, broken down by traffic source. If your Browse CTR is below your niche's expected range - such as under 4% for educational content or under 6% for entertainment - it could mean your thumbnails and titles aren't resonating with casual viewers.
Use the design patterns you've noticed to refine your approach. Compare your content topics and thumbnail designs to those of your competitors. Are there standout topics they're covering that you haven't explored yet? Or are your videos on similar topics underperforming? These gaps often point to a packaging issue - the audience demand exists, but your presentation isn't hitting the mark.
Testing and Adjusting Based on What You Find
Competitor insights are only useful if you take action. Use the data from your tracking framework to test changes based on specific hypotheses. For example: "Competitor thumbnails in my niche often feature a human face with a high-contrast background, while mine rely on text-only designs. I'll test a face-forward approach in my next video."
YouTube's Test & Compare tool allows you to run up to three thumbnail variations at once. Test one element at a time - like background color or the presence of a face - to pinpoint what works best. Channels that use systematic A/B testing have reported a median CTR increase of 33%, improving from a 4.1% baseline to 5.5%. Make sure to gather at least 10,000 impressions before drawing any conclusions.
"The creators who grow fastest aren't the ones with the best design skills. They're the ones who build a feedback loop between their analytics and their creative decisions." - Dan Kim, Founder, Hooksnap
Using AI Tools to Improve Thumbnails Based on CTR Patterns
Breaking Down High-CTR Thumbnails
To understand what makes a thumbnail work, break it down into its essential elements. Focus on aspects like where the subject is placed, the size of the text, how colors contrast, and even the expressions on faces.
The stats behind successful thumbnails are incredibly detailed. For example, thumbnails with shocked expressions can increase click-through rates (CTR) by an impressive 45%. A single face taking up 30–50% of the thumbnail? That adds 38%. Text in the top-left corner improves readability and boosts CTR by 34%, while keeping the text short - just 3–5 words - can lead to a 28% increase. And don’t underestimate curiosity gaps; they can drive CTR up by 54%.
Creating Reusable Thumbnail Templates
Once you've nailed down the patterns that work in your niche, the next step is to create a system you can use repeatedly. A reusable template locks in elements like where the face goes, the font style, the color scheme, and where the text appears. This way, you’re not starting from scratch every time.
Templates also make A/B testing easier. When you use a consistent base design, you can tweak just one variable at a time, making it much simpler to figure out what works best. This method not only saves time but also ensures that your experiments produce clear, actionable results. With this setup, AI tools vs manual design can help you churn out thumbnails quickly without sacrificing quality.
Speeding Up Thumbnail Design With ThumbnailCreator
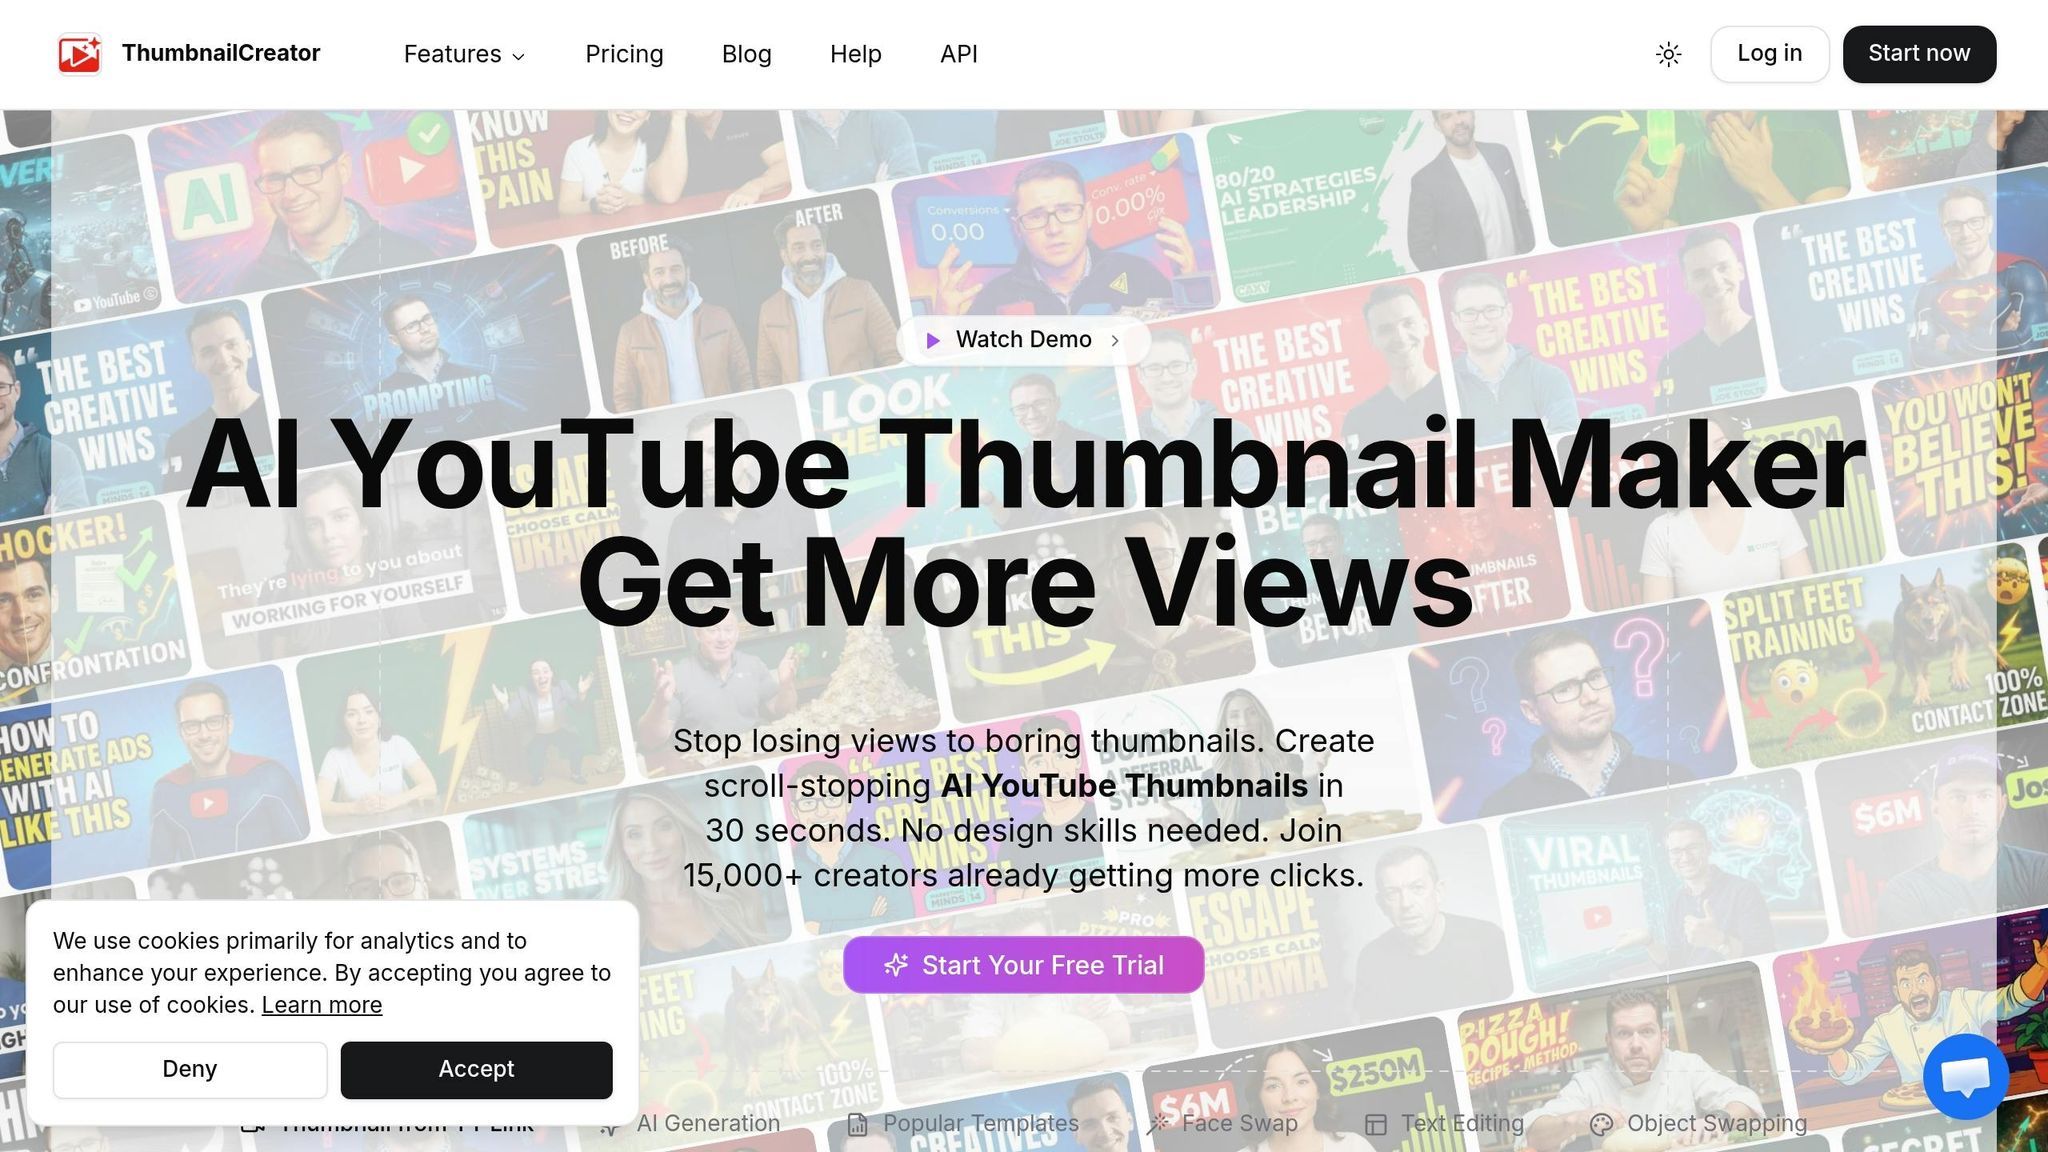
ThumbnailCreator is a game-changer when it comes to turning competitor insights into eye-catching thumbnails. Its AI-driven features let you generate multiple variations in no time - perfect for YouTube’s A/B testing, which can identify the best-performing thumbnail within 24–48 hours.
The platform offers tools like face swapping and text editing, letting you apply proven design strategies - like placing a face on the right and text in the top-left - without starting from scratch. You can even build a personal style library from your top-performing designs and apply these styles consistently to new content.
With AI-generated backgrounds now featured in 68% of thumbnails, ThumbnailCreator’s background generation tool helps you stay relevant. Plus, it avoids the 12% performance dip associated with fully AI-generated thumbnails, giving you the best of both worlds.
The workflow is straightforward: study what works for your competitors, identify the design rules, and let ThumbnailCreator do the heavy lifting. No advanced design skills? No problem. This process is all about boosting your CTR with minimal effort.
How to Measure the Impact of Competitor-Informed Changes
Tracking CTR and Related Metrics in YouTube Studio
After making competitor-inspired tweaks to your thumbnails or titles, it's time to measure their performance using YouTube Studio. The key metrics to monitor include CTR (Click-Through Rate) benchmarks, impressions, Average View Duration (AVD), and traffic sources. These metrics work best when analyzed together.
Keep in mind that as impressions increase, CTR might naturally drop because your content is being shown to a broader audience. It’s also important to note where your clicks are coming from. For instance, CTR from Browse and Homepage traffic behaves differently than CTR from Search traffic. Each source has its own baseline. A decline in Browse CTR doesn’t always mean your thumbnail is underperforming - it could simply mean the algorithm is testing your video with a less familiar audience. To get a clearer picture of your changes, focus on traffic-source-specific CTR rather than relying on your overall channel average.
Running a Before-and-After Analysis
To evaluate the impact of your updates, compare the 7-day average CTR before and after the change. This approach smooths out daily fluctuations, giving you a more reliable metric to work with.
Before drawing conclusions, ensure your updated thumbnails or titles have accumulated at least 1,000 impressions. If you’re using YouTube’s "Test and Compare" tool, which allows you to test up to three thumbnail variations at once, the standard two-week test period is usually sufficient to identify a winner based on watch time.
It’s worth noting that a high CTR alone isn’t enough. For example, a 12% CTR paired with a 15% retention rate could indicate clickbait, which the algorithm might penalize. Strong retention must accompany CTR improvements for lasting success.
"A high CTR is only valuable if retention stays strong - both metrics need to move together." - Mike Holp, Founder, TubeAnalytics
Use these insights to refine your content packaging and make data-driven adjustments.
Refining Your Strategy Based on Results
To keep improving, pick an underperforming video and compare it with one of your best-performing ones. Look at their traffic sources, evaluate how well the thumbnail or title aligns with the video’s promise in the first 30 seconds (using the "Intro" retention metric in YouTube Studio), and identify where viewers tend to drop off.
Based on these observations - and leveraging the competitor insights you’ve gathered - introduce changes one at a time. For example, update either the thumbnail or the title, but not both simultaneously. This method helps you pinpoint what’s driving the improvement. Over time, this approach builds a customized performance database that surpasses simple competitor comparisons, creating a cycle of continuous learning and optimization.
Increase Your CTR With This EASY Strategy
Conclusion: Turning Competitor CTR Into Growth Opportunities
Competitor CTR signals may not always be direct, but they reveal themselves through standout videos, audience engagement trends, and design strategies. The creators who experience the most rapid growth tend to focus less on perfecting their design skills and more on creating a feedback loop between their analytics and creative decisions.
"The creators who grow fastest aren't the ones with the best design skills. They're the ones who build a feedback loop between their analytics and their creative decisions." - Dan Kim, Founder, Hooksnap
When interpreted effectively, these signals can guide meaningful content adjustments. For instance, even a modest 1% boost in CTR can result in 20–30% more total views. However, while a strong CTR gets viewers in the door, retention is what keeps them watching. A video with a 5% CTR and a 60% average view duration will almost always outperform one with a 12% CTR but only a 15% average view duration.
To make the most of this data, consider running quarterly competitor audits, tracking standout videos, refining your thumbnails to suit the traffic source, avoiding common thumbnail mistakes that kill CTR, and systematically testing your updates. Tools like ThumbnailCreator can streamline the design process, allowing you to act on insights quickly instead of getting stuck in production. By consistently analyzing these patterns, you'll uncover opportunities for meaningful growth.
FAQs
How can I estimate a competitor’s CTR without access to their analytics?
To get a sense of a competitor’s CTR, compare the performance of their videos to their channel’s average. Pay attention to videos with noticeably higher view counts - these often hint at stronger CTR. For more reliable insights, stick to analyzing videos with at least 1,000 impressions, as smaller sample sizes can distort the data. Organize their videos into performance tiers to spot which thumbnails attract clicks from new viewers versus those that mainly engage loyal subscribers.
What CTR should I target for my niche and traffic sources?
When determining a target CTR, it's crucial to consider your specific niche and traffic sources rather than relying on the general average of 4%-5%. Different categories and traffic sources yield varying CTR benchmarks.
For example, Gaming and Entertainment content often achieves higher CTRs, ranging between 8%-15%, while Educational or Podcast content tends to fall in the 2%-6% range. Similarly, your traffic source influences CTR expectations:
- Search traffic: Typically sees 8%-15%.
- Suggested Videos: Averages around 5%-10%.
- Browse Features: Falls between 3%-7%.
To align with these patterns and improve your CTR, consider using tools like ThumbnailCreator to refine and optimize your video thumbnails. A well-designed thumbnail can make all the difference in attracting clicks.
How can I raise CTR without hurting retention or triggering clickbait signals?
To increase your click-through rate (CTR) while keeping viewers engaged (and avoiding the dreaded clickbait label), your thumbnail needs to make an honest promise - one your video fulfills early on. Misleading thumbnails might get clicks, but they often tank retention and harm your video's performance in recommendations.
Here are some tips to strike the right balance:
- Follow Through Quickly: Make sure the video delivers on the thumbnail's promise within the first 30% of its runtime. Hook your audience early by addressing what they came for.
- Use Curiosity Gaps Wisely: Create intrigue, but don’t mislead. The visuals and text on your thumbnail should match the actual content.
- Test and Optimize: Use tools like ThumbnailCreator to experiment with different designs. Look for a layout that attracts clicks while keeping viewers engaged.
The key is to build trust with your audience - get them to click and stay.