

Ultimate Guide to Average View Duration Analysis
I use average view duration (AVD) to check viewing depth - not to judge a video on its own. Divide watch time by views: 600 minutes ÷ 200 views equals 3 minutes per view. For Shorts, use engaged views instead.
Here’s how I turn that number into a plan:
- Measure: Find AVD in YouTube Studio and check it alongside average percentage viewed, watch time, and CTR.
- Compare: Match videos by format, topic, length, and time since publication. Check traffic sources and viewer groups before blaming the content. For specific genres, reviewing commentary thumbnail ideas can help align expectations with your niche's standards.
- Diagnose: Review the first 30 seconds, dips, spikes, and ending. Retention shows <u>where to look - not why viewers left</u>.
- Test and track: Change one thing - such as the opening, pacing, length, or thumbnail promise - and log results over matching 7- or 28-day windows.
My goal is simple: help viewers get what they clicked for, then check whether the results support the change.
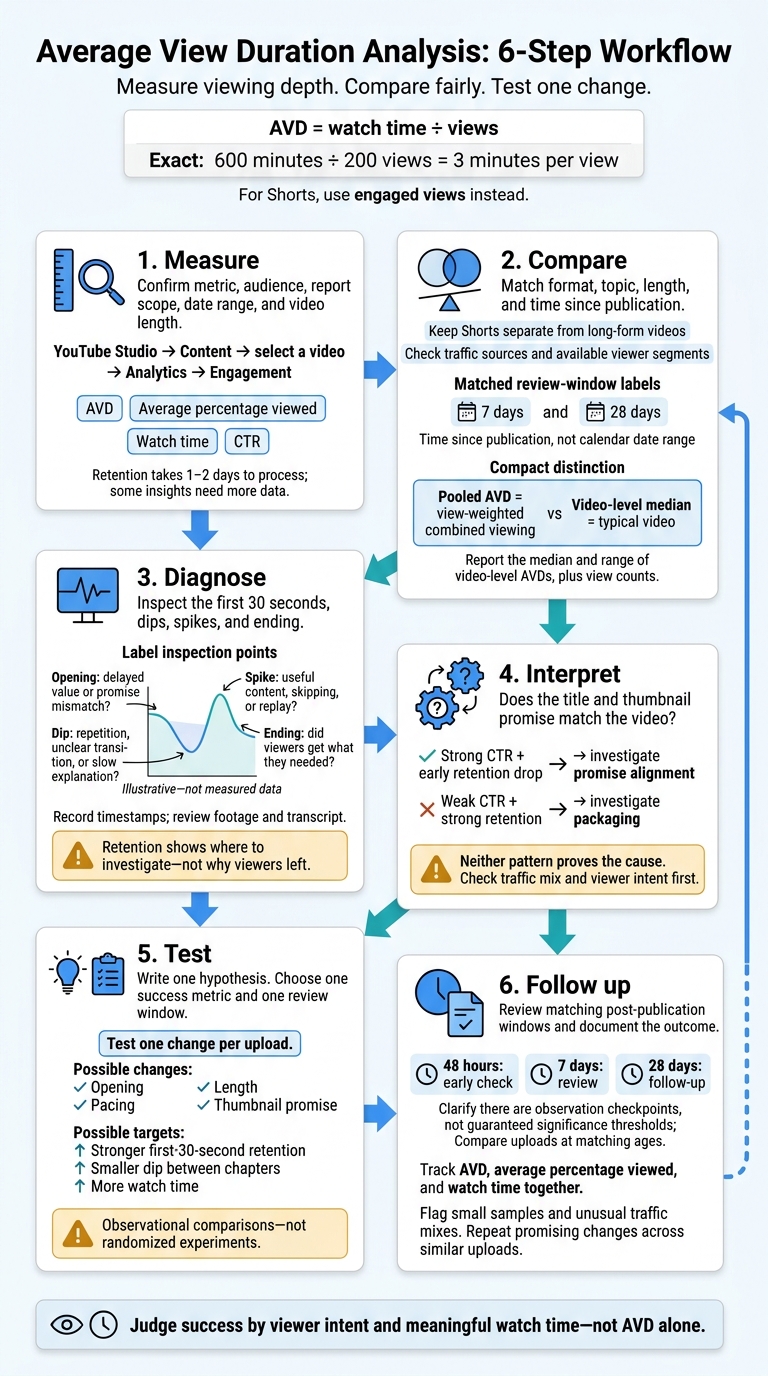
Average View Duration Analysis: 6-Step Workflow
Find and Compare Average View Duration in YouTube Studio
Open Engagement and Audience Retention Reports
Use average view duration (AVD) to see the overall result, then check retention to understand why it changed.
Go to YouTube Studio → Content → select a video → Analytics → Engagement. Look for AVD and the audience-retention curve; labels may differ by video format. Retention takes 1–2 days to process, and some highlighted insights need more data before they appear.
Before deciding what caused a change, match opening losses, dips, spikes, plateaus, and ending behavior to your script sections, chapters, and edit points. Record results at 48 hours, 7 days, and 28 days to separate early shifts from lasting patterns.
Group Similar Videos for Comparison
Open Advanced Mode or See More, then use Groups to collect similar videos. Each custom group can hold up to 500 videos.
Keep Shorts separate from long-form videos, and match videos by topic, length, and each upload’s first 28 days. Comparing differently aged uploads within one calendar range can muddy the results. Use available traffic-source and viewer-segment filters to account for differences such as Search versus Browse or new versus returning viewers.
Pooled AVD is view-weighted, which means one high-traffic upload can dominate the group’s result. Export individual results and report the median and range of video-level AVDs, plus view counts. The pooled figure describes the group’s combined viewing; the median represents the typical video.
With that baseline in place, check the retention curve for exact drop-off points.
Choose the Right Comparison Method
| Method | Best use | Advantages | Limitations |
|---|---|---|---|
| Channel average | Setting a broad baseline | Fast to check and easy to track over time | Mixes formats, topics, lengths, and traffic sources |
| Individual video average | Diagnosing one upload | Shows the result for a specific title, format, and audience | Sensitive to sample size and unusual traffic |
| Retention curve | Finding where attention changes | Shows opening losses, dips, spikes, plateaus, and ending behavior | Needs interpretation and may be missing or incomplete for newer or low-view videos |
| Same-format group | Comparing a content plan or experiment | Reduces noise by grouping similar videos; Advanced Mode supports group comparisons | High-view videos or inconsistent group rules can still skew results |
| Public video signals | Benchmarking another channel | Views, upload dates, visible engagement, and video length add context | Cannot show private AVD or retention |
Compare opening, midpoint, and ending retention alongside AVD, average percentage viewed, and total watch time. Where available, YouTube’s typical retention benchmark uses the last 10 videos of similar length. Treat it as a starting point, not a replacement for matched groups.
These comparisons help pinpoint where viewers leave and assess whether the problem starts with the packaging or the content.
sbb-itb-b59debf
How To Increase Average View Duration on YouTube
Find Possible Causes of Viewer Drop-Off
Once retention shows where attention changes, check whether the cause is the hook, the content, or the audience mix.
Review Opening Losses, Dips, and Spikes
Retention shows where to investigate - not why viewers left. If viewers leave during the first 30 seconds, look for delayed value or an opening that doesn’t deliver on the promise. At mid-video dips, check for repeated points, unclear transitions, or slow explanations. A spike could reflect useful content, viewers skipping ahead, or replays caused by confusion. A late exit may simply mean viewers got what they came for.
Record the timestamp and size of each change, then review the footage and transcript. Did the segment match the promise? Was the transition clear? Did the pace hold up? Compare the passage with available typical retention, rather than a universal target, before calling it a problem.
Use those checks to help separate packaging issues from content issues.
Separate Packaging Problems From Content Problems
Strong CTR paired with an early retention drop may mean the title or thumbnail promises more than the opening delivers. Weak CTR paired with strong retention points toward a packaging issue. In these cases, A/B testing thumbnails can help identify which visuals better align with the content.
Neither pattern proves the cause. Check traffic mix and viewer intent first. CTR can fall when YouTube distributes a video to a broader audience. Read AVD alongside watch time to judge the overall effect.
Then check whether the drop appears across the audience or only within one viewer segment or traffic source.
Compare Viewer Segments and Traffic Sources
Start by checking whether the audience mix changed. A shift toward viewers less familiar with your content can lower overall AVD even when the content hasn’t changed. Compare new versus returning viewers, subscribers versus nonsubscribers, and geography, using only the segment cuts the report supports.
Compare videos with similar topics, formats, lengths, and viewer intent. Repeated losses at the same explanation may point to a mismatch with viewer expectations. A drop that appears in only one upload calls for a closer look at pacing and clarity. Treat both as hypotheses, not findings. Check view counts alongside percentages, mark small-sample findings as provisional, and reassess once the audience mix stabilizes.
Improve Retention and Track Results
Compare similar videos to find one retention drop and its timestamp. Form one hypothesis, make one change in the next similar upload, and check how retention changes. These comparisons are observational, not randomized experiments. Topic, timing, packaging, and audience can all affect results. Repeat promising changes across similar uploads before drawing conclusions.
Test Openings, Pacing, and Video Length
An early drop points to the opening. A drop near the midpoint or ending calls for a pacing or structure test. Before editing, choose your target: stronger first-30-second retention, a smaller dip between chapters, or more watch time.
Test one change per upload. Deliver the promised value earlier, cut repeated explanations, shorten pauses, clarify transitions, reorder chapters, or add on-screen labels and diagrams. Let viewer intent guide video length - not a fixed runtime target.
Review AVD, average percentage viewed, and watch time together. Longer videos can increase AVD while lowering proportional completion; shorter videos can do the reverse. Check whether you met your target without losing useful detail or viewer satisfaction. Record the change and its outcome, not just the metric that improved.
Match Thumbnails to the Video’s Promise
If the problem starts before the click, fix the promise first. Use ThumbnailCreator to make accurate thumbnail variations quickly. Keep the pictured result and promised benefit true to the footage.
Review CTR alongside retention and watch time. More clicks aren't a win if viewers leave soon after. The tool helps you create thumbnail variations; it doesn't directly improve AVD or guarantee higher CTR.
Keep a Consistent Performance Dashboard
Log every test in one dashboard so you can spot patterns across uploads. Use one row per video to record its ID, publication date, topic, format, length, views, AVD, average percentage viewed, watch time, first-30-second retention, dips, spikes, impressions, CTR, traffic sources, and available viewer segments.
Add notes about the title promise, thumbnail concept, opening, chapters, pacing, editing changes, hypothesis, and outcome.
Compare matching 7-, 28-, or 90-day post-publication windows. Keep separate benchmarks for long-form videos, Shorts, and livestreams. Flag small samples and unusual traffic mixes, and update benchmarks as audiences change. Label video-level medians separately from pooled view-weighted averages to avoid skew.
Conclusion: Average View Duration Analysis Checklist
Use AVD to check whether viewers got what they came for - not just to chase a higher number. Follow this checklist to make the analysis repeatable:
- Measure: Confirm the metric, audience, report scope, date range, and video length. Record the export date, since YouTube data changes as results are processed.
- Compare: Compare similar videos over matching 24-hour, 7-day, or 28-day windows.
- Diagnose: Review the opening, dips, and spikes, and note their timestamps. Check traffic sources and viewer segments before drawing conclusions.
- Interpret: Check whether the title and thumbnail match what the video delivers.
- Test: Test one focused change. Before publishing, write one hypothesis and set one success metric and one review window.
- Follow up: Recheck results when the review window ends and document what you learned. Judge success by viewer intent and meaningful watch time, not AVD alone.
FAQs
What is a good average view duration for my niche?
A good average view duration depends on your niche and video length. Aim for viewers to watch at least 50% of your video as a rule of thumb. Educational content often has 50–65% retention, while gaming videos tend to see 35–45%. Longer videos usually retain a smaller percentage of their runtime, so 45–50% is often considered strong.
Use ThumbnailCreator to match your thumbnails to your content. This helps set the right expectations and reduce early viewer drop-off when a video doesn’t match what its thumbnail promises.
How many views do I need for reliable AVD analysis?
Aim for 200 to 300 views per video before analyzing average view duration (AVD). That gives you enough data to judge whether your thumbnail matches what viewers expect. Wait until the early traffic swings after upload have settled before drawing conclusions.
For A/B tests, collect at least 1,000 impressions per variant to check that your findings are statistically sound.
Can replays push average percentage viewed above 100%?
No. Average percentage viewed is capped at 100%, even if viewers replay parts of a video. It measures your audience’s average engagement relative to the video’s total length.