

Thumbnail Tests and Subscriber Lift: Guide
More clicks don’t always mean more subscribers. Test up to 3 thumbnails while keeping the title and video unchanged, then compare subscriber conversion with a matched baseline - not just CTR.
The process comes down to three steps:
- Set up the test: Record a 14- or 28-day baseline, keep other settings fixed, and log traffic or promotion changes.
- Track the full path: Review impressions, CTR, viewing, and video-level subscribers gained. Calculate subscriber conversion as subscribers gained ÷ views × 100.
- Check the result: Compare matching date ranges, account for audience shifts, and repeat data-driven patterns across comparable videos.
YouTube’s thumbnail test reports watch-time share, not subscriber conversion. Higher conversion during the test is an observed change - not proof that one thumbnail caused it.
How To Setup a YouTube A/B Thumbnail Test (Step by Step)
sbb-itb-b59debf
Step 1: Set Up a Controlled Thumbnail Test
Choose a published long-form video with steady demand and a stable traffic mix. Use the previous 14 or 28 days as your baseline window. Pick a video that still gets enough impressions for a comparison. Too little traffic can leave the test inconclusive.
Keep everything else unchanged: metadata, end screens, cards, visibility, and promotion. Log outside changes separately, including new uploads, creator mentions, paid promotion, holidays, news, or traffic shifts. These can affect who watches - and who subscribes - regardless of the thumbnail. You're testing whether the thumbnail changes subscriber lift, not just clicks.
Create 2 or 3 Focused Thumbnail Variants
Test one visual idea at a time, such as a larger subject, less text, a different expression, or more emphasis on the product versus the presenter. Keep image quality similar across versions, and make sure each thumbnail accurately reflects the video's promise. Label the files A, B, and C, save the original, and note what each version changes.
ThumbnailCreator lets you make consistent variants using templates, AI generation, text editing, face swapping, and object swapping. Keep the rest of the setup unchanged so you can compare versions. Export every thumbnail at the same size and check that each reads clearly when displayed small.
Start the Test and Record Reporting Dates
In YouTube Studio, open the video and select the thumbnail testing or Test & compare option. Upload up to 3 thumbnails, test only the thumbnail, and allow a few days to 2 weeks for completion. Treat the report as a signal of thumbnail performance - not subscriber lift. You'll assess subscriber lift through the video analytics in the next step.
Don't edit the title or thumbnail during the test; edits can stop it. Run the variants at the same time rather than swapping them one after another. This reduces timing and audience bias.
Record your baseline dates, actual test start and end dates, and analytics export date. Keep variant results separate from video-level views and subscribers gained, and use matched reporting windows. YouTube's test results show watch-time share, not subscriber conversion.
Next, compare the test result with click-through, viewing, and subscriber data.
Step 2: Track Clicks, Viewing, and Subscribers Gained
Compare CTR With Post-Click Viewing
Use Reach to check CTR and Engagement to see how people watched during the test dates. The Impressions and how they led to watch time report links registered thumbnail impressions to CTR, views, and watch time.
Views from external sites, notifications, and end screens may not have counted impressions. That’s why total views ÷ impressions won’t match CTR.
| Metric | Role | Interpretation | Main limitation |
|---|---|---|---|
| Impressions CTR | Measures click appeal | Shows how often a registered impression led to a view | Excludes some view sources |
| Views | Measures viewing volume | Shows total views during the selected period | Includes views without counted impressions |
| Watch time | Measures total time watched | Pair with average view duration to assess viewing depth | Can increase with more views even when viewing depth falls |
| Audience retention | Shows where viewers stay or leave | Early drops can suggest unmet expectations | Can vary by traffic source and audience size |
Check watch time driven by impressions alongside CTR, but keep it separate from total watch time. Review retention during the first 30 seconds, where available. High CTR paired with shorter viewing and an early retention drop suggests the thumbnail promised something the video didn’t deliver. Then connect those viewing signals to subscriber gains for the video.
Find Video-Level Subscribers Gained
In Analytics → Advanced Mode, record subscribers gained on this video, views, watch time, impressions, and impressions CTR. Export the video’s data using the same date range, filters, and attribution scope.
When available, check Subscription source to separate watch-page subscriptions from gains attributed to other surfaces. YouTube may not let you combine every dimension with every metric.
Calculate Conversion and Review Audience Mix
Calculate conversion using the same views and subscriber counts. To make results easier to track, also calculate subscribers per 1,000 views = subscribers gained ÷ views × 1,000. Keep the raw counts beside these rates - small samples can make percentage swings look bigger than they are.
Where the report allows, review traffic source, device, geography, new versus returning viewers, and the share of existing subscribers. A shift toward existing subscribers can lower conversion without meaning the thumbnail performed poorly.
Unless you have explicit variant-level subscriber data, report conversion as a period-level result. Don’t attribute those subscriber gains to one thumbnail. Use these period-level numbers in Step 3 to check whether the thumbnail test beat the baseline.
Step 3: Evaluate Changes in Subscriber Conversion
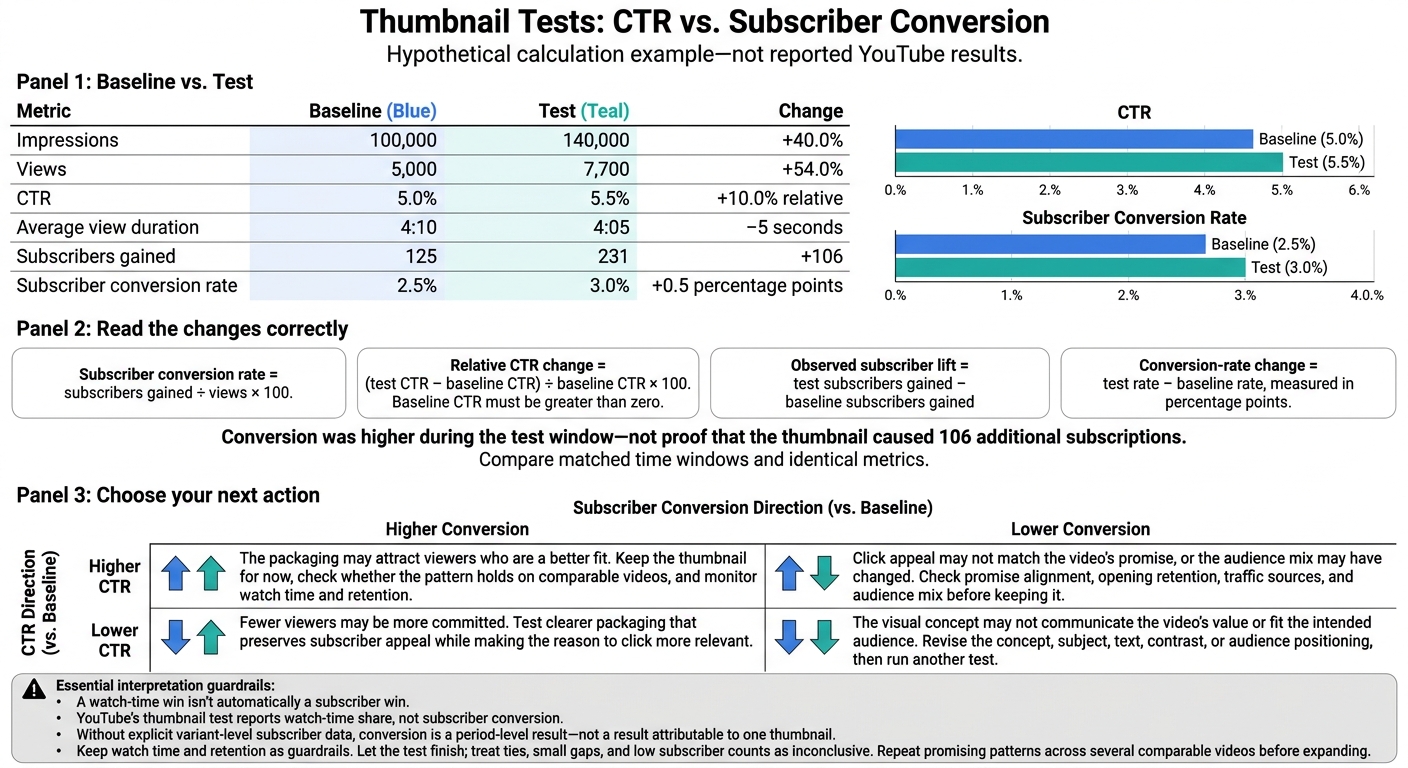
Thumbnail Tests: CTR vs. Subscriber Conversion
Compare Test Results With the Baseline
Use your metrics to check whether subscriber conversion changed during the thumbnail test. Compare matched time windows and identical metrics.
- Relative CTR change =
(test CTR − baseline CTR) ÷ baseline CTR × 100. Baseline CTR must be greater than zero. - Observed subscriber lift =
test subscribers gained − baseline subscribers gained. - Conversion-rate change =
test rate − baseline rate, measured in percentage points.
The example below shows how to read these changes - not how to credit one thumbnail for them.
Hypothetical calculation example - not reported YouTube results.
Metric Baseline Test Change Impressions 100,000 140,000 +40.0% Views 5,000 7,700 +54.0% CTR 5.0% 5.5% +10.0% relative Average view duration 4:10 4:05 −5 seconds Subscribers gained 125 231 +106 Subscriber conversion rate 2.5% 3.0% +0.5 percentage points
Here, observed conversion increased, while average view duration dipped slightly. Report that conversion was higher during the test window - not that the thumbnail caused 106 additional subscriptions.
Choose Your Next Action
Use the rate comparison to decide whether to keep the thumbnail change for subscriber growth. “Higher” and “lower” refer only to the baseline window. A watch-time win isn't automatically a subscriber win.
| Outcome | Interpretation | Next action |
|---|---|---|
| Higher CTR and higher conversion | The packaging may attract viewers who are a better fit. | Keep the thumbnail for now, check whether the pattern holds on comparable videos, and monitor watch time and retention. |
| Higher CTR but lower conversion | The thumbnail may draw clicks without matching the video’s promise, or it may reach a different audience mix. | Check promise alignment, opening retention, traffic sources, and audience mix before keeping it. |
| Lower CTR but higher conversion | The thumbnail may attract fewer but more committed viewers. | Test clearer packaging that keeps the stronger subscriber appeal while making the reason to click more relevant. |
| Lower CTR and lower conversion | The visual concept may not communicate the video’s value or fit the intended audience. | Revise the concept, subject, text, contrast, or audience positioning, then run another test. |
Keep watch time and retention as guardrails. Treat shifts based on small samples as inconclusive. Even when a test window looks better, check the result before applying the change more broadly.
Check Results Before Applying Them More Broadly
Let the test finish. Stopping after a brief spike can make the result look more certain than it is. Treat ties, small gaps, and low subscriber counts as inconclusive. Repeat promising patterns across several comparable videos before expanding.
Conclusion: Confirm Subscriber Gains Before Expanding
Use advanced thumbnail optimization to measure success across the full path from impressions to subscribers - not just CTR.
Scale only when the same design principle improves subscriber conversion across multiple comparable videos.
FAQs
How many subscriber gains make my test meaningful?
Focus on click quality, not a set number of new subscribers. Look for a higher click-through rate (CTR) paired with steady or better retention, average view duration, and total watch time.
If subscriber numbers grow too, your thumbnail is drawing the right audience. But if CTR climbs while retention or subscriber growth stays flat or falls, your thumbnail may promise more than the video delivers - or draw viewers who aren’t a good fit for your channel.
What if my traffic mix changes mid-test?
A change in traffic mix can skew your results because each source behaves differently. Search traffic often has higher intent than browse traffic, so a shift between sources can push metrics up or down.
Compare thumbnail variants by source - Browse, Search, and Suggested - not just overall totals. If the variants get very different shares of traffic from each source, collect more impressions until the mix is stable enough to support a sound comparison.
Should I prioritize conversion rate or total subscriber gains?
Don’t put total subscriber gains ahead of conversion rate. Measure success through a balance of click-through rate (CTR), viewer retention, and overall watch-time share. A high CTR only matters if viewers keep watching. When clicks lead to a sharp drop in retention, that mismatch can hurt your channel’s long-term performance.
Treat subscriber growth as a secondary check that your thumbnail consistently draws the right audience - not just short-term clicks.