

YouTube Engagement Rate Tools: Comparison
I’d start with YouTube Studio’s free analytics for your own channel - and use public-data tools only for competitor checks. Views, CTR, and engagement rate measure different things. I compare these six tools by accuracy, coverage, ease of use, and cost, not as interchangeable engagement-rate calculators.
Quick Comparison
| Tool | Accuracy and metrics | Channel coverage | Main workflow | Listed cost |
|---|---|---|---|---|
| YouTube Studio | First-party performance data | Channels you own or manage | Analytics, exports, and native testing | Free |
| Social Blade | Public counts; some counts are rounded | Public channel data | Channel growth comparisons | Not confirmed |
| HypeAuditor | YouTube engagement method not documented in the supplied sources | Not confirmed | Influencer screening | Not confirmed |
| vidIQ | Analytics and SEO guidance; no documented engagement formula | Own-channel guidance; competitor previews | Keyword research and content planning | Free tier; paid plans from $7.50/month |
| TubeBuddy | thumbnail A/B testing; scheduled rotation can affect results | Channel testing; audience features on higher tiers | Thumbnail and metadata testing | Free tier; Pro $6.00/month; Legend $26.39/month |
| ViewStats | Public view velocity, not engagement rate | Public video data | Web dashboard and Chrome extension | Not confirmed |
For a fair comparison, I’d use <u>the same reporting window, video age, and content format</u>. You can also optimize your visuals using YouTube thumbnail guides to improve initial click-through potential. I’d also keep likes, comments, CTR, retention, and watch time separate rather than treat them as one score.
This comparison uses documented features, not hands-on testing. Listed prices are from the supplied material - not verified as of October 1, 2026 - so I’d check current prices and plan limits before paying.
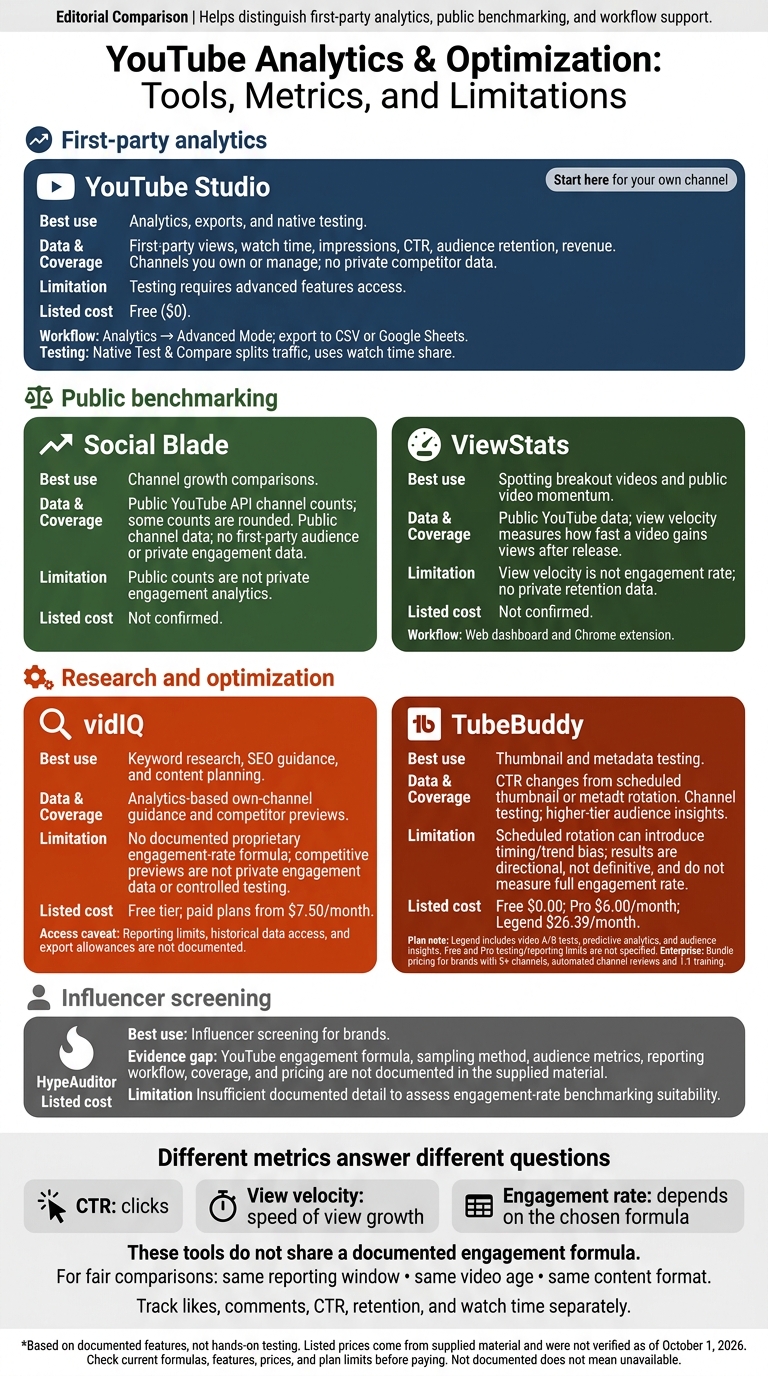
YouTube Analytics Tools: Choose by Data and Workflow
1. YouTube Studio
Data accuracy
YouTube Studio gives users with channel access first-party data on views, watch time, impressions, CTR, audience retention, and revenue. It’s the most accurate source for your own channel’s data.
Competitor and audience coverage
Studio covers channels you own or have permission to access. It doesn’t show competitors’ private watch time, impressions, CTR, retention, or revenue, and it can’t measure their engagement rates directly.
Reporting workflow
Go to Analytics → Advanced Mode to filter data by geography, traffic source, age, or device. You can then export it to CSV or Google Sheets.
Pricing and access limits
YouTube Studio is free - there’s no separate analytics subscription. Use it as your baseline when judging the third-party tools below.
sbb-itb-b59debf
Better Video Comparison Features in YouTube Analytics!
2. Social Blade
Unlike YouTube Studio, Social Blade uses public channel data. It works for surface-level competitor checks, not first-party analytics.
Data accuracy and formula
Social Blade relies on public data from the YouTube API. Public counts are rounded rather than exact, so treat them as estimates. Keep those counts separate from earnings estimates and engagement rates.
Its strength is comparing public channel data - not analyzing private performance.
Competitor and audience coverage
Social Blade shows public counts, but it cannot provide first-party engagement or audience data.
Reporting workflow
Use the same date range for every channel, and keep public counts separate from engagement-rate calculations.
Pricing and access limits
The supplied sources do not confirm pricing, free-tier limits, history depth, or export access. Check Social Blade’s latest details before relying on it for recurring competitor reports.
3. HypeAuditor
The supplied sources don’t provide enough detail to assess HypeAuditor’s accuracy, coverage, workflow, or cost. They don’t document its YouTube engagement formula, sampling method, audience metrics, reporting workflow, or pricing.
The next tools are easier to compare because their data access and workflows are documented.
4. vidIQ
vidIQ works best when you combine engagement analysis with SEO and keyword research.
Data accuracy and formula
vidIQ draws on YouTube analytics and SEO signals, but the sources don’t document a proprietary engagement-rate formula. Its value lies in analytics-based guidance, rather than a documented standalone engagement rate.
Competitor and audience coverage
The sources don’t document competitor tracking or cross-channel audience data.
Reporting workflow
Use vidIQ to research keywords and trends, including current thumbnail trends, then review its channel suggestions for SEO fixes. The documentation doesn’t define a standard engagement-rate report, export process, or historical data window. That makes it better suited to planning than formal engagement-rate reporting.
Pricing
A free tier is available, and paid plans start at $7.50 per month. The sources don’t document competitor-tracking limits, historical data access, or export allowances.
5. TubeBuddy
TubeBuddy moves beyond native analytics to focus on thumbnail and metadata testing.
Data accuracy and formula
TubeBuddy works best for CTR testing, not for calculating engagement rate on its own. Its A/B tests rotate thumbnails or metadata on a set schedule and track CTR changes. Treat those results as directional - not definitive.
It can help you see what drives more clicks, but it doesn’t measure full engagement rate by itself.
Competitor and audience coverage
Higher-tier plans add predictive analytics and audience insights.
Reporting workflow
Run A/B tests in TubeBuddy, then check CTR changes for the same time window in YouTube Studio. Scheduled rotation can skew results because timing and trends may affect performance.
YouTube’s native Test & Compare splits traffic simultaneously and uses watch time share as its primary success metric.
Pricing and access limits
Plan differences matter most when you need A/B testing and audience features.
| Plan | Listed price | Engagement-related access |
|---|---|---|
| Free | $0.00 | Basic access; testing and reporting limits not specified |
| Pro | $6.00/mo | Testing and reporting limits not specified |
| Legend | $26.39/mo | Video A/B tests, predictive analytics, and audience insights |
| Enterprise | Bundle pricing | For brands with 3+ channels; includes automated channel reviews and 1:1 training |
6. ViewStats
Data accuracy and formula
ViewStats focuses on public video momentum rather than click testing. It uses public YouTube data to track view velocity - how fast a video gains views after release. This metric points to early traction, but it isn’t an engagement rate.
Competitor and audience coverage
ViewStats helps you spot public uploads that gain traction fastest. It’s useful for finding breakout videos, but it cannot show retention or true audience engagement.
Reporting workflow
ViewStats offers a web dashboard and a Chrome extension that displays metrics directly on YouTube pages. That makes it easy to check video performance at a glance.
Pricing and access limits
The provided sources do not list current U.S. pricing or plan limits.
Comparing Accuracy, Coverage, Usability, and Cost
This comparison is based on documented features and pricing, not hands-on testing. For a consistent comparison, use matched channels, the same reporting window, and separate content formats.
The tables distinguish documented metrics from estimates.
Data Sources and Engagement Formulas
These tools don’t share a documented engagement formula, so compare raw counts and rates separately. YouTube Studio provides native performance data for channels you own, and its Test & Compare feature focuses on watch time share. Public previews are estimates - not replacements for private analytics. After establishing thumbnail CTR benchmarks for your niche, When judging performance, look beyond CTR to watch time share and average view duration.
| Tool | Verifiable data source | What you can compare | Accuracy caveat |
|---|---|---|---|
| YouTube Studio | Internal channel data | Native metrics and Test & Compare results | Match reporting windows and video sets |
| Social Blade | Public YouTube API data | Public channel counts | Rounded counts, not private engagement data |
| HypeAuditor | - | - | Not documented in the supplied material |
| vidIQ | Preview modes for competitive research | Click-potential previews, not engagement data | Not owned-channel analytics |
| TubeBuddy | Thumbnail-test workflow | A/B testing in Legend | Scheduled rotation can introduce bias |
| ViewStats | Public YouTube data | View velocity and video momentum | View velocity is not engagement rate |
Next, check how much channel and audience data each tool can access.
Channel and Audience Coverage
Keep comparisons limited to the channel types and data each tool can see.
| Tool | Own-channel depth | Competitor depth | Audience insights | Reporting granularity |
|---|---|---|---|---|
| YouTube Studio | Internal performance metrics | No private competitor data | Native audience metrics | Native testing metrics |
| Social Blade | Public counts | Public counts | No first-party audience data | Further detail not documented in the supplied material |
| HypeAuditor | - | - | - | Not documented in the supplied material |
| vidIQ | - | Preview modes for competitive research | - | Click-potential previews, not engagement data |
| TubeBuddy | Thumbnail testing | - | Higher-tier audience insights | Thumbnail-test results |
| ViewStats | Public video momentum | Public video momentum | No private retention data | Further detail not documented in the supplied material |
Setup and Reporting Workflow
YouTube Studio splits traffic simultaneously, giving it a more controlled testing workflow than TubeBuddy’s scheduled thumbnail rotation. With scheduled rotation, timing and trends can affect the results.
| Tool | Setup | Reporting navigation | Workflow notes |
|---|---|---|---|
| YouTube Studio | Access to the channel you own or manage | Native analytics and Test & Compare | Simultaneous traffic splitting |
| Social Blade | - | Public channel comparisons | Further detail not documented in the supplied material |
| HypeAuditor | - | - | Not documented in the supplied material |
| vidIQ | - | Preview modes for competitive research | Comparison views, not controlled testing |
| TubeBuddy | Verify channel permissions | Thumbnail-test workflow | Scheduled rotation can introduce bias |
| ViewStats | Web dashboard or Chrome extension | Metrics on YouTube pages | Further detail not documented in the supplied material |
Before weighing cost, check which data each tool can verify.
Free Access and Paid Plans
These prices come from the supplied material. Check current prices and access limits on official pricing pages before publishing.
| Tool | Free access | Monthly price | Limits and notes |
|---|---|---|---|
| YouTube Studio | Free | $0 | Testing requires advanced features access |
| Social Blade | - | - | Not documented in the supplied material |
| HypeAuditor | - | - | Not documented in the supplied material |
| vidIQ | Free tier | From $7.50 | Reporting limits not documented |
| TubeBuddy | Basic access | Pro: $6.00; Legend: $26.39 | Legend includes A/B testing |
| ViewStats | - | - | Not documented in the supplied material |
Pros, Cons, and Who Each Tool Suits
Match each tool to the data you need: first-party analytics, public benchmarking, or workflow support.
| Tool | Main advantages | Main disadvantages | Best-fit user |
|---|---|---|---|
| YouTube Studio | First-party analytics and controlled testing for your own channel. | Requires access to advanced features, and reports can lag. | Established creators with steady traffic. |
| Social Blade | Public counts help compare channel performance. | Public data shows changes, but not what caused engagement to change. | Creators and analysts tracking channel growth rather than diagnosing individual videos. |
| HypeAuditor | Built to evaluate influencers and screen creators for brands. | The supplied material does not explain its YouTube engagement method or reporting depth. | Brand marketers checking whether a creator fits their brand. |
| vidIQ | Connects with YouTube analytics and helps with keyword research and content suggestions. | Search previews and suggestions help with planning, but they do not measure CTR. | Creators focused on SEO and data-driven content research. |
| TubeBuddy | Combines search optimization, A/B testing, and productivity tools. | Free access is limited, and scheduled rotation can bias results. | Creators who want a regular optimization workflow. |
| ViewStats | Public video momentum helps spot uploads gaining attention. | Momentum shows which videos are gaining traction, but not why. | Researchers tracking which videos are accelerating across channels. |
Conclusion: Choose by Data Access and Workflow
When you move from comparing tools to choosing one, start with the data you can access.
Use YouTube Studio for owned-channel data, Social Blade or ViewStats for public trends, and vidIQ or TubeBuddy for research and optimization. Choose HypeAuditor for influencer screening - not engagement-rate benchmarking.
For benchmarking, stick to one engagement formula, one video age, and one format. Track CTR, retention, watch time, likes, and comments separately.
Before committing or paying, check the current formulas, features, prices, and plan limits.
FAQs
How do I calculate my YouTube engagement rate?
Most tools use this formula to calculate your YouTube engagement rate:
((Total likes + comments + shares + subscribers) / Total views) × 100
The percentage shows how well your content connects with your audience.
For context, the average YouTube engagement rate is typically around 2%. A rate of 3% to 7% is considered solid, while anything above 10% is considered outstanding.
What is a good engagement rate for my niche?
On YouTube, around 2% is a good engagement rate. A rate of 3% to 7% is solid, while anything above 10% is outstanding.
For click-through rate (CTR), compare results by traffic source, not just one blended number. A good CTR is typically 4% to 5%, but search often reaches 8% to 15%, while browse features range from 3.5% to 4.5%. Aim for at least 1,000 impressions to spot meaningful trends in your niche.
Should I measure Shorts engagement differently?
Yes. Shorts use different algorithms and draw different viewing habits than long-form videos. Use tools with a dedicated Shorts view to keep short-form data separate from long-form metrics.
YouTube’s native Test and Compare feature, often used to optimize thumbnails, does not currently support Shorts.