

YouTube Engagement Benchmarks by Industry 2026
I’d compare your latest 10–20 uploads with similar channels - not one YouTube-wide average. Match your niche, subscriber count, format, and video age—and balance clickbait with authentic thumbnails—before judging results. Use (likes + comments) ÷ views × 100, and keep studies with other formulas separate.
I cover 12 industries through November 7, 2026, plus subscriber tiers, long-form videos, Shorts, and live streams. Here’s a quick comparison of the reported figures - not a ranking.
Quick Comparison
| Industry | Reported engagement reference | Main comparison limit |
|---|---|---|
| Beauty | 3.6% median | Non-sponsored creator videos |
| Education | 4.42% median | No format or subscriber-tier breakdown |
| Gaming | 2.07%–4.18% medians | Different samples and methods |
| Finance | About 3.9% median | Large U.S. finance and investing channels |
| Fitness | 2.9% median | Includes shares; not the base formula |
| Travel | 3.1% median | U.S. and U.K. creator sample |
| Technology | 1.65% median | Broad Science & Technology category |
| Music | 0.65% median | 930 uploads from 16 large channels |
| Cooking | 1.6% benchmark | Other reported figures use different formulas |
| News | 2.290% median | Long-form videos |
| Sports | 1.33% median | Channel-level, long-form results |
| Film & Animation | 0.43% median | 463 non-kids uploads from four channels |
My rule: <u>match the measurement before comparing the percentage</u>. Keep formats separate, check how Shorts views are counted, and read engagement alongside retention, watch time, and returning viewers. Then use your peer median to plan tests over the next 30–90 days.
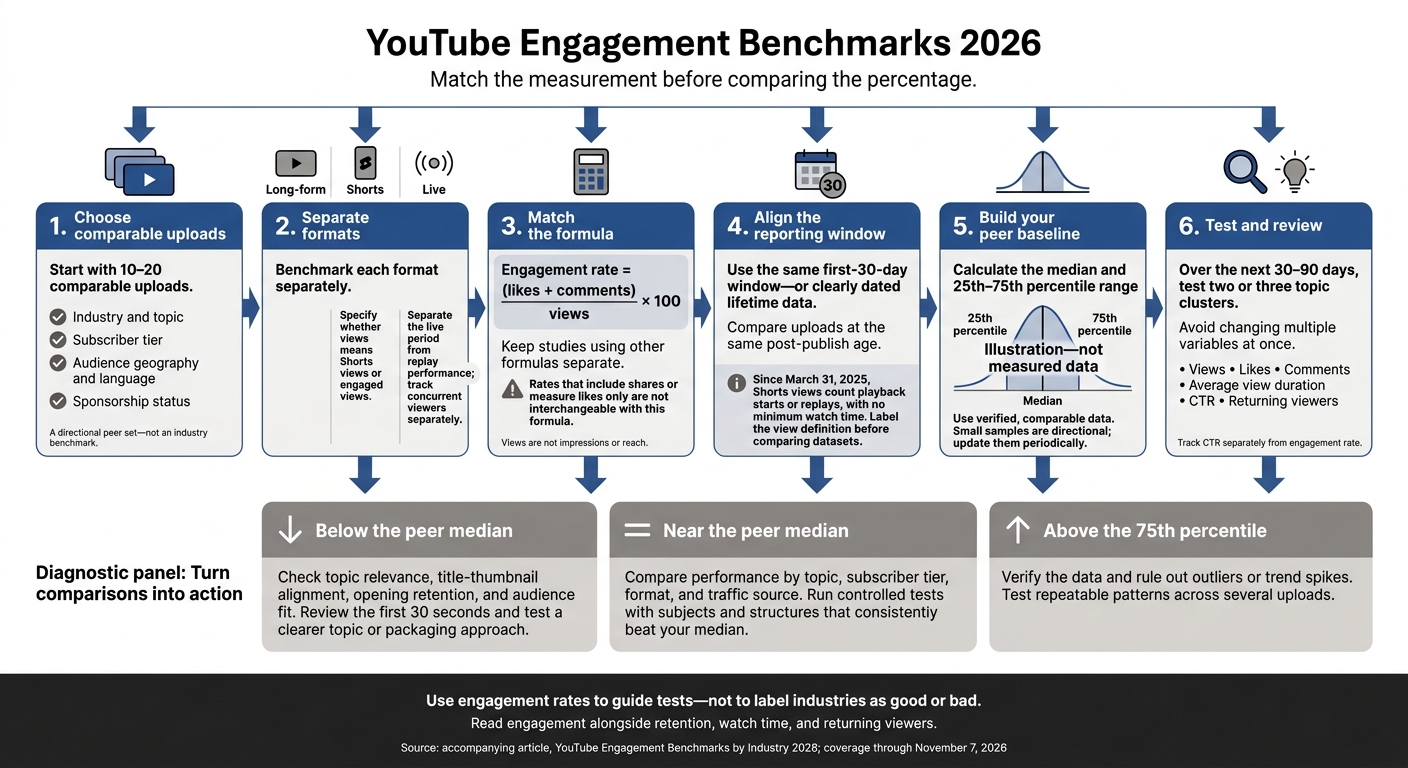
YouTube Engagement Benchmarks 2026: Compare Your Channel Fairly
1. Beauty
Industry Engagement Rates
Kyra’s 2026 study of 10,836 non-sponsored Beauty videos across 396 U.S. and U.K. creator channels with at least 1,000 subscribers found a 3.6% median engagement rate by views. The middle 50% fell between 2.1% and 5.4%.
Use that organic median as your baseline, then assess paid videos and individual formats separately. It’s a benchmark for Beauty as a whole - not a standalone standard for makeup, skincare, or hair. Benchmarketing reports a separate 2.4% median for Beauty YouTube ads.
Video-Format Differences
Compare Shorts with Shorts and long-form with long-form. In the same Beauty sample, Kyra reports 3.5% for Shorts and 3.7% for long-form. Another 2026 study found 2.364% for Shorts and 4.659% for long-form. The samples and measurement rules differ, so only compare results when the methods match.
Live streams need their own metrics. No Beauty-specific live benchmark is available. Track live chat rate, peak and average concurrent viewers, replay engagement, and returning viewers separately from the video benchmark.
Calculate your median across 10–20 comparable uploads, separating results by format, topic, and sponsorship status. Review videos below 2.1% for weak audience response. This often stems from common thumbnail mistakes that hurt click-through rates. Study those above 5.4% for strengths you can repeat, such as clear steps, a strong transformation payoff, or useful comment prompts. Treat these thresholds as points to investigate - not pass/fail grades.
sbb-itb-b59debf
2. Education
Industry Engagement Rates
A separate dataset reported a 4.42% median Education engagement rate, compared with 2.68% for Film & Animation. Use this comparison as a guide, not a universal target.
Public engagement tells only part of the story in Education. Retention often says more. Track watch time and retention separately: educational videos can hold viewers’ attention without getting unusually high numbers of likes or comments.
Compare similar educational audiences and topics. K–12, test prep, language learning, career skills, higher education, STEM explainers, study skills, and kids’ educational content perform differently. Before calculating benchmarks, label each video by topic, audience, language, and region, or use thumbnail testing at scale to organize larger catalogs.
Supporting the focus on retention, a six-year study of Sígueme la Corriente found that educational videos averaged 47% retention versus 42.3% for general informational videos and 2,007 subscribers per video versus 425 - one-channel evidence, not an industry benchmark or causal proof.
No subscriber-tier or format-specific benchmarks are provided here. Choose metrics based on the format:
- Long-form lessons: Average view duration, percentage viewed, retention drop-offs, and session watch time.
- Shorts: Engaged views and swipe-away rate.
- Live classes or tutoring: Peak and average concurrent viewers, total watch time, chat activity, and replay performance.
What Metrics Should Businesses Focus On to Measure the Success of Their YouTube Strategy?
3. Gaming
Gaming benchmarks change with the game, audience, and format. Compare like with like to get a useful read on performance.
Industry Engagement Rates
There’s no single engagement target for gaming in 2026. Gaming content includes gameplay videos, walkthroughs, reviews, tutorials, speedruns, challenge videos, esports coverage, livestreams, and Shorts. When enough data is available, compare creators within the same game community - not against publisher channels or esports broadcasts.
| Source | Reported Gaming engagement | Sample context |
|---|---|---|
| Virev | 2.07% median | 389,600 long-form videos from 33,465 public channels with at least 1,000 subscribers |
| YTGrowth | 3.809% median; 4.217% mean | 2,912 gaming videos |
| SociaVault Labs | 4.18% median | 2026 category benchmark |
These datasets aren’t interchangeable targets. The median is the middle result, while outliers can pull the mean upward.
Channel size adds another layer to these category-level rates.
Subscriber-Tier Percentiles
One source reports engagement rates of 2.7% for channels with 1,000–10,000 subscribers, 1.8% for 10,000–50,000, and 1.1% for 50,000–500,000. Its top-10% figures for those same groups are 4.9%, 3.1%, and 2.1%, respectively.
Even within the same subscriber tier, format affects performance.
Video-Format Differences
Don’t apply upload benchmarks to live gaming. Measure livestreams through concurrent viewers, watch time, and chat activity. Compare Shorts and edited uploads in separate groups, too.
Use your latest 10–20 uploads as a baseline, matching them by game, format, and subscriber tier. If engagement falls behind peers, test stronger opening hooks and clearer thumbnails. Track click-through rate separately.
4. Finance
Industry Engagement Rates
Finance engagement depends on what viewers want and which money topics you cover. Benchmark against the closest topic group, and use only studies that match your engagement formula.
A 2026 benchmark for large U.S. finance and investing channels reports a median engagement rate of about 3.9%. A separate cohort of channels with 100,000–1,000,000 subscribers reports 3.77%.
A study of 72 active U.S. personal-finance channels and 3,600 videos shows how much topic matters. Budgeting and frugal living leads at 5.31%, compared with 2.06% for money advice and commentary and 2.42% for investing and real estate. Use the closest topic group for your comparison.
Video-Format Differences
Once you've matched the topic, look at format. Build a 30-day baseline for each topic and format: long-form, Shorts, and live streams. Track median engagement alongside average percentage viewed, returning viewers, and comments per 1,000 views.
For financial content, include dates, assumptions, and disclosures. Don't trade accuracy for engagement by using clickbait vs authentic thumbnails.
5. Fitness
Industry Engagement Rates
A 2026 dataset covering 135 U.S. and U.K. fitness and health channels and 3,093 Shorts and long-form videos reports 2.9% median engagement. The middle 50% falls between 1.7% and 4.8%. Its formula is (likes + comments + shares) ÷ views × 100, so use it as a separate interaction benchmark - not a direct match to this article’s base engagement rate.
Within fitness, sub-niche matters more than the category average. A separate channel analysis reports median engagement of 2.52% for home workouts across 25 channels, 2.67% for gym and bodybuilding across 21 channels, and 2.92% for yoga, Pilates, and mobility across 18 channels.
Subscriber count changes the comparison, too. That same analysis reports median engagement of 2.66% for channels with 30,000–250,000 subscribers, 2.73% for 250,000–1 million, and 2.13% for more than 1 million.
Video-Format Differences
While engagement rates vary by format, your visual strategy should remain consistent. You can create fitness thumbnails that align with these specific sub-niches to improve initial click-through potential.
Once you've accounted for sub-niche and channel size, compare formats separately. In the same analysis, Shorts account for 78% of gym and bodybuilding content, compared with 34% for home workouts and 24% for yoga, Pilates, and mobility. Those gaps show how much the content mix differs across fitness sub-niches.
Match your tracking to the format:
- Follow-along videos: Track retention and average view duration.
- Shorts: Track viewed vs. swiped-away rate, rewatches, and shares.
- Live workouts: Track concurrent viewers and chat participation.
For Shorts, a view counts when the video starts or replays, with no minimum watch time. That counting rule can affect comparisons with older Shorts data.
6. Travel
Industry Engagement Rates
A 2026 creator benchmark puts median engagement by views at 3.1%, with the middle 50% ranging from 1.7% to 5.0%. The sample covers U.S. and U.K. travel creators with at least 1,000 subscribers and includes 1,670 Shorts and long-form videos not flagged as advertising.
Brand accounts have a different baseline. A 2025 Dash Social sample of 644 global YouTube brand accounts found an average Travel engagement rate of 0.4% from July through December 2024. Use this as a separate corporate reference - not a direct comparison with the creator median.
Video-Format Differences
A separate 2026 Travel dataset reports median engagement of 2.508% for Shorts and 3.248% for long-form videos. That puts long-form about 29% higher, but it’s a directional signal, not a promise of results. Keep these figures separate from the creator sample above. No Travel live benchmark is available.
Travel research does not establish reliable benchmarks by subcategory or subscriber tier. To account for format differences, compare 10–20 matching channels based on geography, audience size, travel content, and sponsorship status. Measure uploads at a consistent age within 3–7 days after publication, then calculate the median and middle 50%. Keep Shorts, long-form videos, and sponsored uploads separate. Assess live streams separately using concurrent viewers and chat activity.
7. Technology
Industry Engagement Rates
A broad international study puts the median engagement rate for Science & Technology at 1.65%. Separate research reports 3.4% for Technology & Programming among top U.S. channels with 100,000+ subscribers and 3.94% for Technology Reviews. These benchmarks are useful only when the audiences have similar reasons for watching.
Before comparing results, check how each study defines engagement. Some include shares or subscriptions. Missing collection dates, audience demographics, and geographic details also limit direct comparisons.
Compare product reviews, troubleshooting, software, and enterprise channels separately. Each serves a different viewer need, so technology-review rates shouldn't become minimum targets for programming or general technology channels.
Video-Format Differences
Video format changes the baseline, too. A 2026 technology dataset reports median engagement of 2.268% for Shorts and 3.031% for long-form videos - about 34% higher for long-form in that sample. Since March 31, 2025, YouTube has counted Shorts views when playback starts, which can make direct comparisons with long-form misleading.
YouTube’s analytics guidance prioritizes watch time and average view duration. For reviews and tutorials, use watch time, retention, and returning viewers to add context to engagement-rate comparisons - not replace them. If viewers leave early, improve the opening or optimize your thumbnails for better click-through rates. If they watch but rarely respond, ask one focused question about the decision or problem the video addresses.
For livestreams, assess concurrent viewers and chat activity rather than applying the long-form engagement rate.
8. Music
Autoplay, playlists, and repeat listening make music different: people can keep listening without leaving likes or comments.
Industry Engagement Rates
A September 30–October 29, 2026 study of 930 Music uploads from 16 large channels reported a 0.65% median engagement rate, with 6.1 likes and 0.29 comments per 1,000 views. A separate benchmark covering 2,758 channels reported 1.02%. These figures come from different samples, so don’t treat them as interchangeable targets.
Passive listening through autoplay, playlists, and repeats means likes and comments can understate interest. No reliable breakdown exists for official videos, covers, lyric videos, live performances, or subscriber tiers. Use a rolling median for similar releases, and keep official tracks separate from interviews, covers, and behind-the-scenes uploads.
Video-Format Differences
YouTube artist analytics separates videos, songs, Shorts, and live streams. It also tracks views and watch time from the YouTube Music app. For full tracks and live performances, look at watch time, average view duration, audience retention, and returning viewers. For Shorts, use engaged views and “stayed to watch.”
Compare releases at the same post-publish age so day-one spikes don’t skew benchmarks for older tracks. Use this baseline when comparing music channels by subscriber tier.
9. Cooking
Cooking includes home cooking, recipe tutorials, baking, meal prep, BBQ, street food, and food challenges.
A U.S. meal-prep channel is not a close peer for a global street-food channel.
The distinction matters: cooking performance varies by topic, audience, and monetization mix.
Industry Engagement Rates
A broader 2026 benchmark puts food-and-cooking engagement at 1.6%. The 2.23% and 2.40% samples use different formulas, so treat them as separate references. The 2.40% figure measures the median like rate and excludes comments. Geography and collection dates aren't disclosed.
A separate 2026 study of 248 U.S. creator cooking channels and 36,100 videos reports these engagement rates by subscriber count:
- 30,000–250,000: 3.57%
- 250,000–1 million: 3.33%
- 1–5 million: 3.31%
- Above 5 million: 2.89%
These are study-specific reference points, not percentiles. Check the denominator and collection window before comparing results.
Video-Format Differences
Engagement alone doesn't tell the whole story. Reach data can help explain why a cooking video gets plenty of views but few likes.
For long-form videos older than seven days, the 60-channel study found that food channels had median views equal to 7.8% of subscribers. The middle 50% ranged from 3.8% to 12.5%. That measures reach, not interaction. These datasets don't establish comparable cooking engagement benchmarks for Shorts or live streams.
Use format-specific baselines because Shorts and live cooking content often perform differently from edited recipes. Build a rolling baseline of 10–20 comparable uploads. If views are low but engagement is normal, improve the title and sharpen the thumbnail. If views are strong but engagement is weak, strengthen the opening.
10. News
News has a short shelf life. Compare posts by topic and time since publication, not raw engagement alone.
The category includes breaking reports, political coverage, explainers, and commentary. YTGrowth uses “News,” while Virev uses “News & Politics.” Those categories may not cover exactly the same content.
Industry Engagement Rates
YTGrowth’s 2026 study analyzed 5,049 News videos in a 49,802-video sample. It calculated engagement as (likes + comments) ÷ views × 100. Long-form News videos had a 2.290% median and a 3.380% mean, suggesting that a few high-performing videos pulled the average up.
Virev’s 2026 benchmark reported a 1.97% median across 1,441 News & Politics channels. The excerpt does not fully explain its formula. It also measures channels rather than individual videos, so keep it separate from YTGrowth’s results.
Use 2.3% only as a long-form reference point. These studies do not establish News-specific subscriber-tier percentiles or verified benchmarks for Shorts or live video.
News engagement can spike fast, so read engagement rates alongside retention and traffic-source data. Compare breaking reports and evergreen explainers at the same age after publication.
Track comments, retention, returning viewers, subscribers gained, and traffic sources. Political discussion can generate more interactions without showing that a channel is building lasting growth.
Lead with the news value and clearly separate reporting from commentary. Reviewing trending YouTube thumbnails can help identify visual cues that signal urgency and authority. Cite primary documents or official sources when possible, and ask one specific question to encourage informed discussion.
11. Sports
Sports depends on events more than most categories. Compare channels by matchup, season, and format, not engagement rate alone.
Industry Engagement Rates
Virev reports a 1.33% median across 772 Sports channels, calculated as (likes + comments) ÷ views × 100 using each channel’s 12 most recent long-form videos. Mark Studios reports 1.54% from 125 long-form videos across three channels. Use both as long-form reference points, not targets for every channel. Format changes the baseline, especially for team channels.
Video-Format Differences
Track Shorts separately because their distribution and viewing behavior differ from long-form videos. Across 149 NFL, NBA, MLB, NHL, and MLS team channels, Shorts made up 52.7% of median uploads during the 180 days ending October 30, 2026. NBA teams had the highest median share at 63.9%, compared with 40.8% for MLB teams. These figures describe the publishing mix - not higher engagement or subscriber conversion.
The available studies do not provide Sports-specific subscriber-tier percentiles.
To benchmark your channel, review your latest 12 public long-form videos and check both the median and range. Separate major-event uploads from offseason games and uploads, then compare peers publishing the same content type.
If engagement matches peers but your impressions click-through rate is weak, make the player, matchup, and stakes clear in the thumbnail. You can find specific design tips in these YouTube thumbnail guides. If clicks are strong but retention is weak, check whether the opening delivers what the title and thumbnail promise.
12. Film & Animation
Industry Engagement Rates
For Film & Animation, read likes and comments alongside retention to understand how viewers respond.
Mark Studios’ 2026 study reports a 0.43% median across 463 non-kids uploads from four channels. It calculates engagement as (likes + comments) ÷ views × 100 and includes only uploads with at least 1,000 views. Virev reports a 0.92% median across 1,354 channels, based on each channel’s 12 most recent long-form uploads. Keep these benchmarks separate: one measures videos, while the other measures channels.
Video-Format Differences
No verified Film & Animation benchmarks are available here for Shorts, live streams, or subscriber tiers. Compare trailers, episodes, commentary reviews, Shorts, and livestreams separately, since viewers watch each format for different reasons. For Shorts, check stayed to watch and engaged views to see whether viewers keep watching rather than swipe away.
Audience-retention reports can help you spot slow introductions or confusing scenes. For story-driven animation, test a clearer opening premise and ask one specific question about a character’s decision. Assess the results using watch time and average view duration, not comments alone.
Use this category baseline before comparing channels by subscriber tier.
YouTube Engagement Benchmarks by Subscriber Tier
Virev reports the following channel-level medians for channels with at least 1,000 subscribers, based on a sample collected August 6–October 19, 2026. Treat these as reported medians, not universal benchmarks. The summary does not disclose the exact formula or clarify whether the median is calculated by channel or video. The unverified 0.64% nano and 0.11% mega figures are excluded.
Match industry and format first, then filter by subscriber tier. The table follows this article’s working bands, with Virev’s original boundaries in the last column.
| Subscriber tier | Subscriber range | 25th percentile | Median engagement rate | 75th percentile | Sample size | Virev’s original boundary |
|---|---|---|---|---|---|---|
| Nano | 1,000–9,999 | Not reported | 1.22% | Not reported | 5,769 channels | 1K–10K |
| Micro | 10,000–99,999 | Not reported | 1.56% | Not reported | 8,010 channels | 10K–100K |
| Mid-tier | 100,000–499,999 | Not reported | 1.88% | Not reported | 6,565 channels | 100K–500K |
| Macro | 500,000–1,000,000 | Not reported | 1.85% | Not reported | 2,526 channels | 500K–1M |
| Mega | Above 1,000,000 | Not reported | 1.62% | Not reported | 4,148 channels | 1M+ |
These figures show differences by channel size - not performance quality on their own. They are not individual-video percentiles. Without a verified matching formula, you also can’t use them interchangeably with this article’s view-based benchmarks.
A small finance channel and a large entertainment channel are not comparable peers; audience intent, topic, reach, and format all change engagement.
To build your own baseline, use 10–20 comparable uploads. Match industry, format, subscriber band, denominator, and observation period before judging performance. Then review each upload’s topic, length, title, news thumbnail templates, audience source, and upload timing.
Engagement by Format: Long-Form, Shorts, and Live
After subscriber tier, filter by format. Each format uses a different view denominator, but the article’s base formula stays the same: (likes + comments) ÷ views × 100. No verified format-level median is reported here. Compare results only when the formula, denominator, industry, geography, subscriber tier, and reporting window match.
- Long-form: Use (likes + comments) ÷ video views × 100. Add watch time, average view duration, and click-through rate (CTR) for context. Effective thumbnails can help improve this metric.
- Shorts: Use (likes + comments) ÷ views × 100. Specify whether “views” means Shorts views or engaged views.
- Live: Use (likes + comments) ÷ live views × 100. Keep concurrent viewers separate.
Views aren’t impressions or reach. Report impressions CTR and subscriber gain rate separately from engagement rate.
For any Shorts benchmark, label the view definition. View counts after March 31, 2025, aren’t interchangeable with older engaged-view data.
Live streams also need separate tracking: live views and concurrent viewers measure different things. Track live views, chat activity, watch time, and concurrent viewers separately. Separate the live stream period from replay performance, and state whether engagement covers only the stream or a defined live-and-replay period.
Conclusion: Choose a Peer Benchmark and Plan Next Steps
Use the industry, subscriber tier, and format comparisons to build a benchmark for your channel.
Start with 10–20 comparable uploads that match your industry, subscriber tier, format, formula, audience, and reporting window. This is a directional peer set - not an industry benchmark. Calculate the median and 25th–75th percentile range using either first-30-day results or clearly dated lifetime data. Keep long-form, Shorts, and live videos separate, and include only verified, comparable positions.
Use this table to check whether the problem is packaging, audience fit, or repeatability.
| Benchmark position | Diagnostic checks | Next action |
|---|---|---|
| Below the peer median | Topic relevance, title-thumbnail alignment, opening retention, and audience fit | Review the first 30 seconds and test a clearer topic or packaging approach with A/B testing. |
| Near the peer median | Performance by topic, subscriber tier, format, and traffic source | Run controlled tests with subjects and structures that consistently beat your median. |
| Above the 75th percentile | Verify the data and rule out outliers or trend spikes. | Test repeatable patterns across several uploads rather than copying one viral result. |
Benchmark comparisons can drift for several reasons. Check these limits before acting on the numbers.
| Limitation | Effect on comparison | Practical safeguard |
|---|---|---|
| Different formulas | Rates may measure different behaviors, making direct rankings misleading. | Publish the numerator, denominator, and calculation method. |
| Small sample sizes | One new upload can shift medians and percentiles by a large amount. | Treat 10–20 uploads as directional and update the sample periodically. |
| Broad category labels | Unrelated content may be grouped together. | Use narrow topic definitions and apply them consistently. |
| Different subscriber tiers | Larger channels usually have different reach and audience dynamics. | Compare channels within defined subscriber bands. |
| Mixed formats | Shorts, long-form, and live videos have different consumption patterns. | Benchmark each format separately. |
| Country and audience differences | Language, culture, purchasing power, and viewer behavior can affect engagement. | Match the primary audience’s geography and language where possible. |
| Different reporting windows | Lifetime data favors older uploads. | Use the same first-30-day window or clearly label lifetime dates. |
| Averages instead of medians | Viral outliers can distort what looks normal. | Report medians and percentile ranges, with averages as extra context. |
Over the next 30–90 days, test two or three topic clusters without changing multiple variables at once. Track views, likes, comments, average view duration, CTR, and returning viewers. Use YouTube Analytics Advanced mode to compare cohorts.
ThumbnailCreator can speed up thumbnail creation, but judge results by retention and watch time, not clicks alone. Use engagement rates to guide tests - not to label industries as good or bad.
FAQs
Can high engagement hide poor channel growth?
Yes. A high click-through rate (CTR) can mask poor channel growth when watch time is low. Lots of clicks paired with low average view duration (AVD) may point to a misleading thumbnail or an audience mismatch.
YouTube prioritizes total watch time, so short viewing sessions can limit future recommendations and stall growth. Check CTR alongside retention data to make sure your thumbnails match what your videos deliver.
How do I benchmark a channel with mixed topics?
Group 10–15 similar videos by topic, format, and audience type. Set a separate performance baseline for each group instead of using one channel-wide average.
Track impressions, click-through rate (CTR), average view duration, and watch time at the same checkpoint for every video - for example, 28 days after publication. That way, your comparisons reflect each content category’s viewer intent and traffic sources.
How can I tell if an engagement increase is meaningful?
Don’t judge metrics on their own. A higher click-through rate (CTR) is a good sign only if average view duration and audience retention hold steady or improve. If CTR climbs but retention drops, your thumbnail may promise more than the video delivers. That mismatch could hurt your channel’s long-term performance.
Compare results against your channel’s median performance, not universal targets. Use controlled tests to check whether gains repeat - or simply came from random traffic spikes.